Football Statistics and Simulation Modelling
Football Apptitude is a football statistics and analysis app bringing together detailed player and team data from across Europe's top leagues, a suite of comparison tools and advanced statistically-derived match simulations.
It is designed as a tool that gives you the data and features to analyse player / team performance in detail, in addition to helping test your own theories about team and player performance.
Data is synced to your device for fast, offline-ready browsing.
-
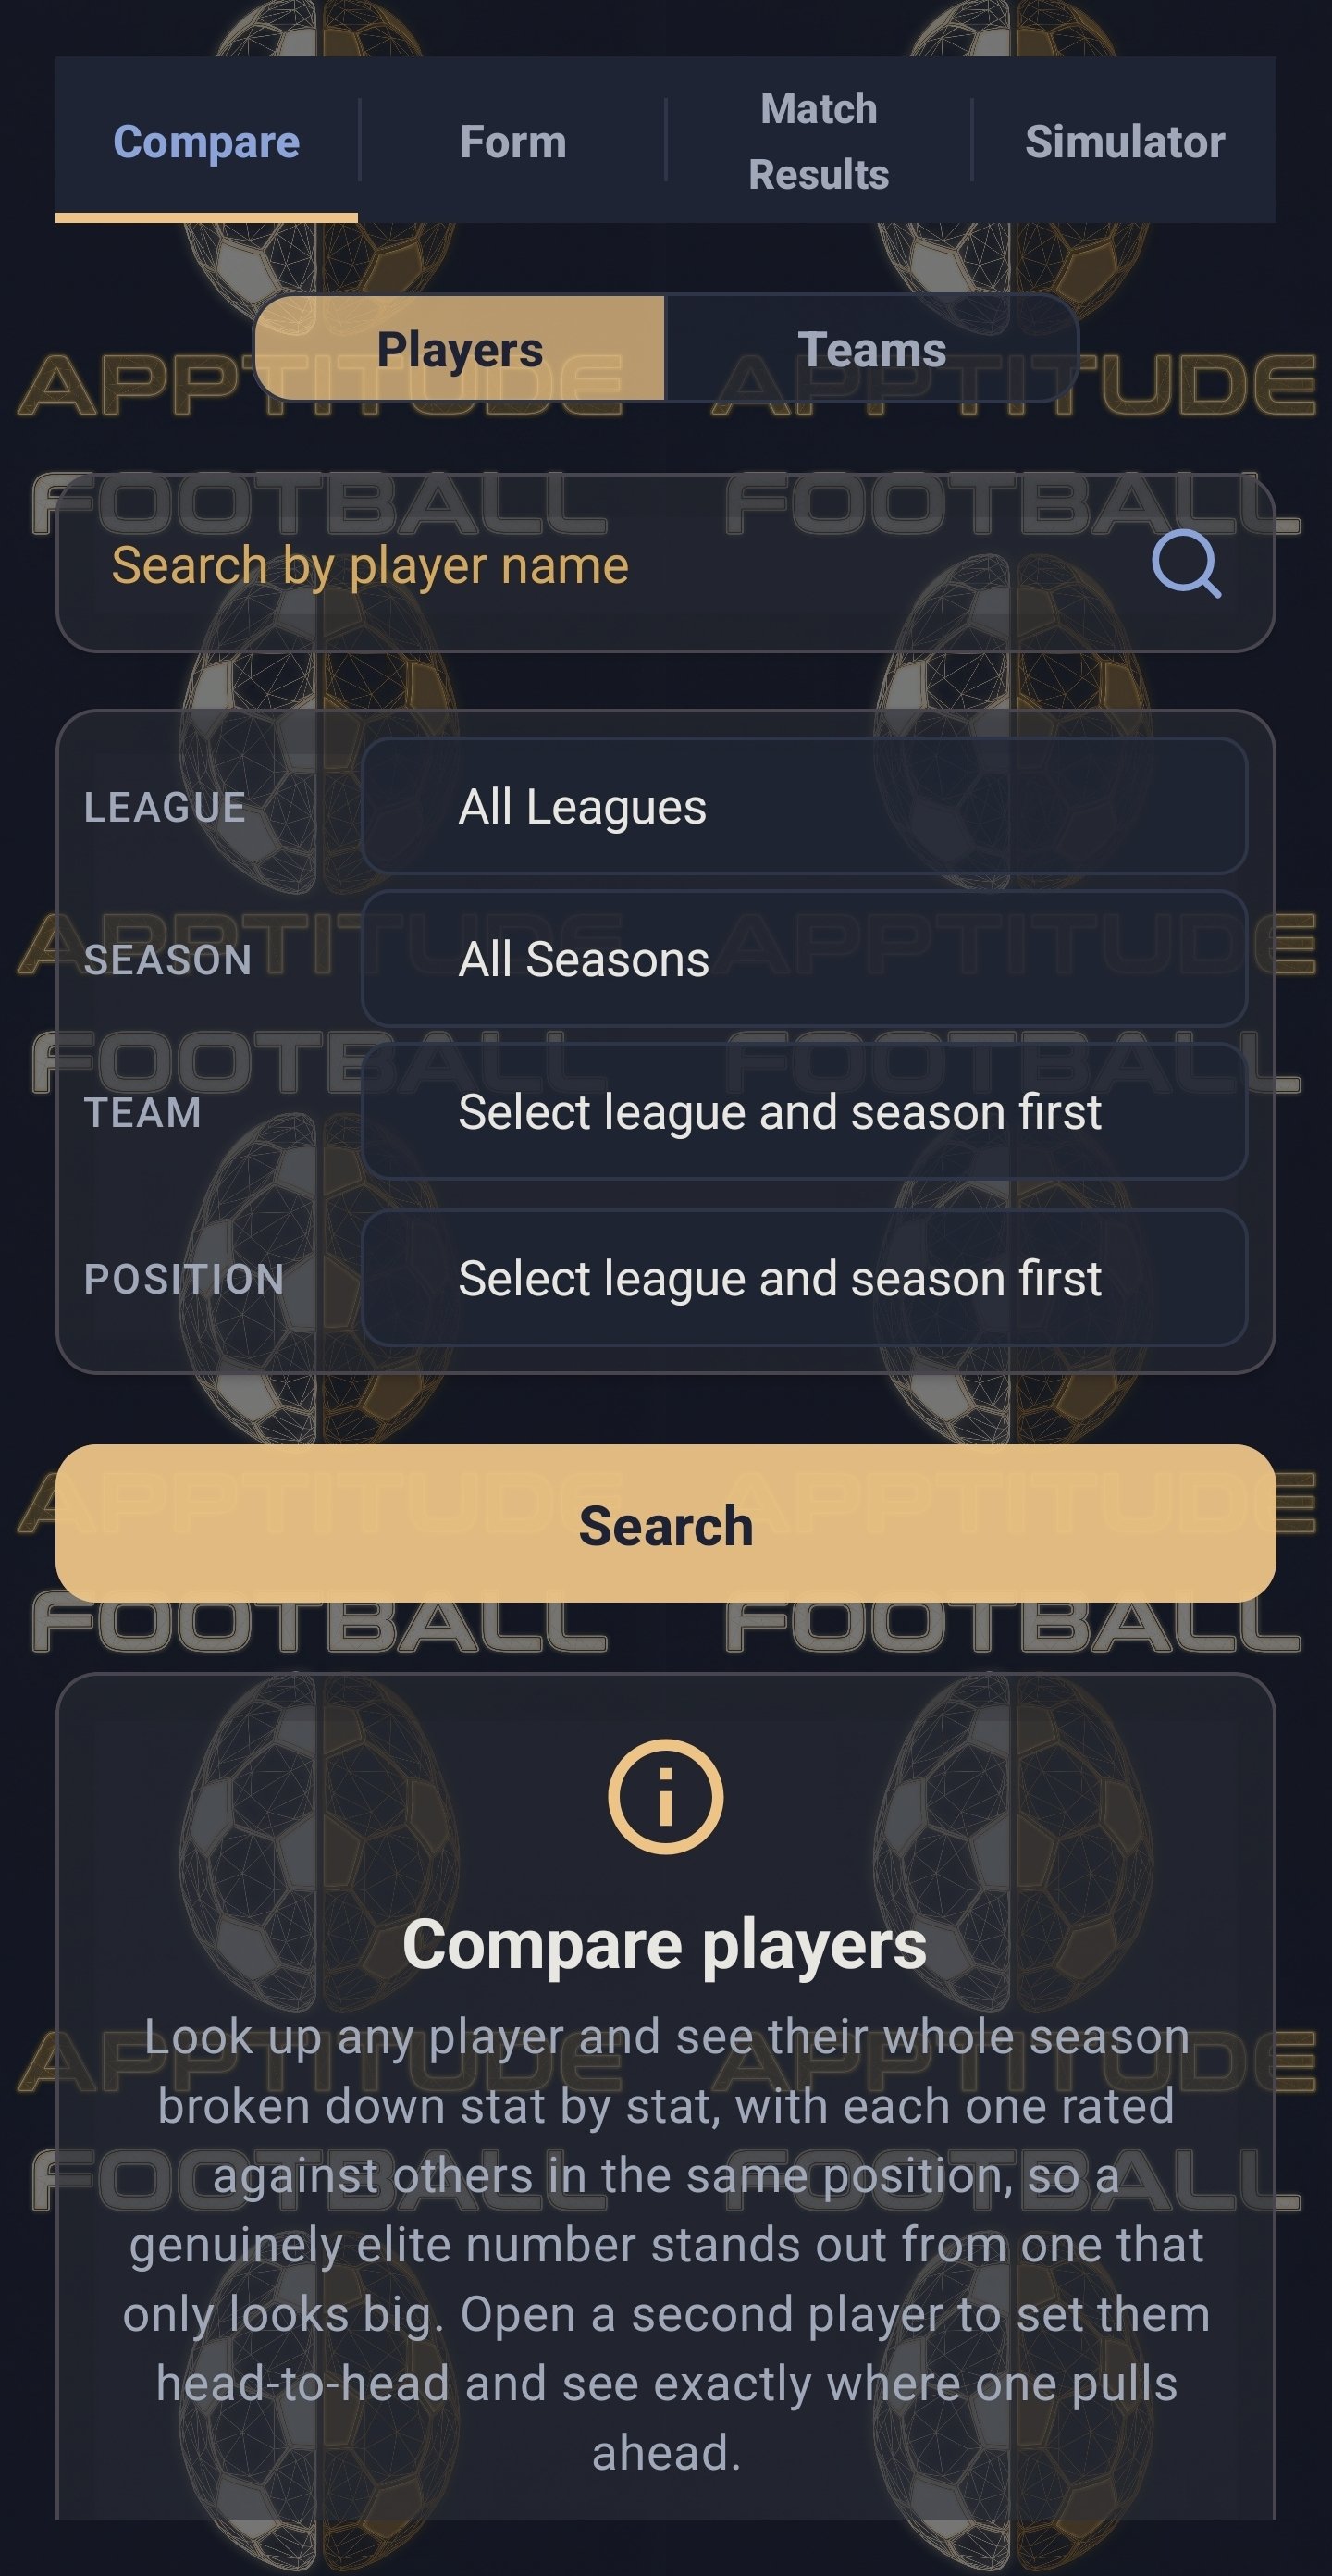
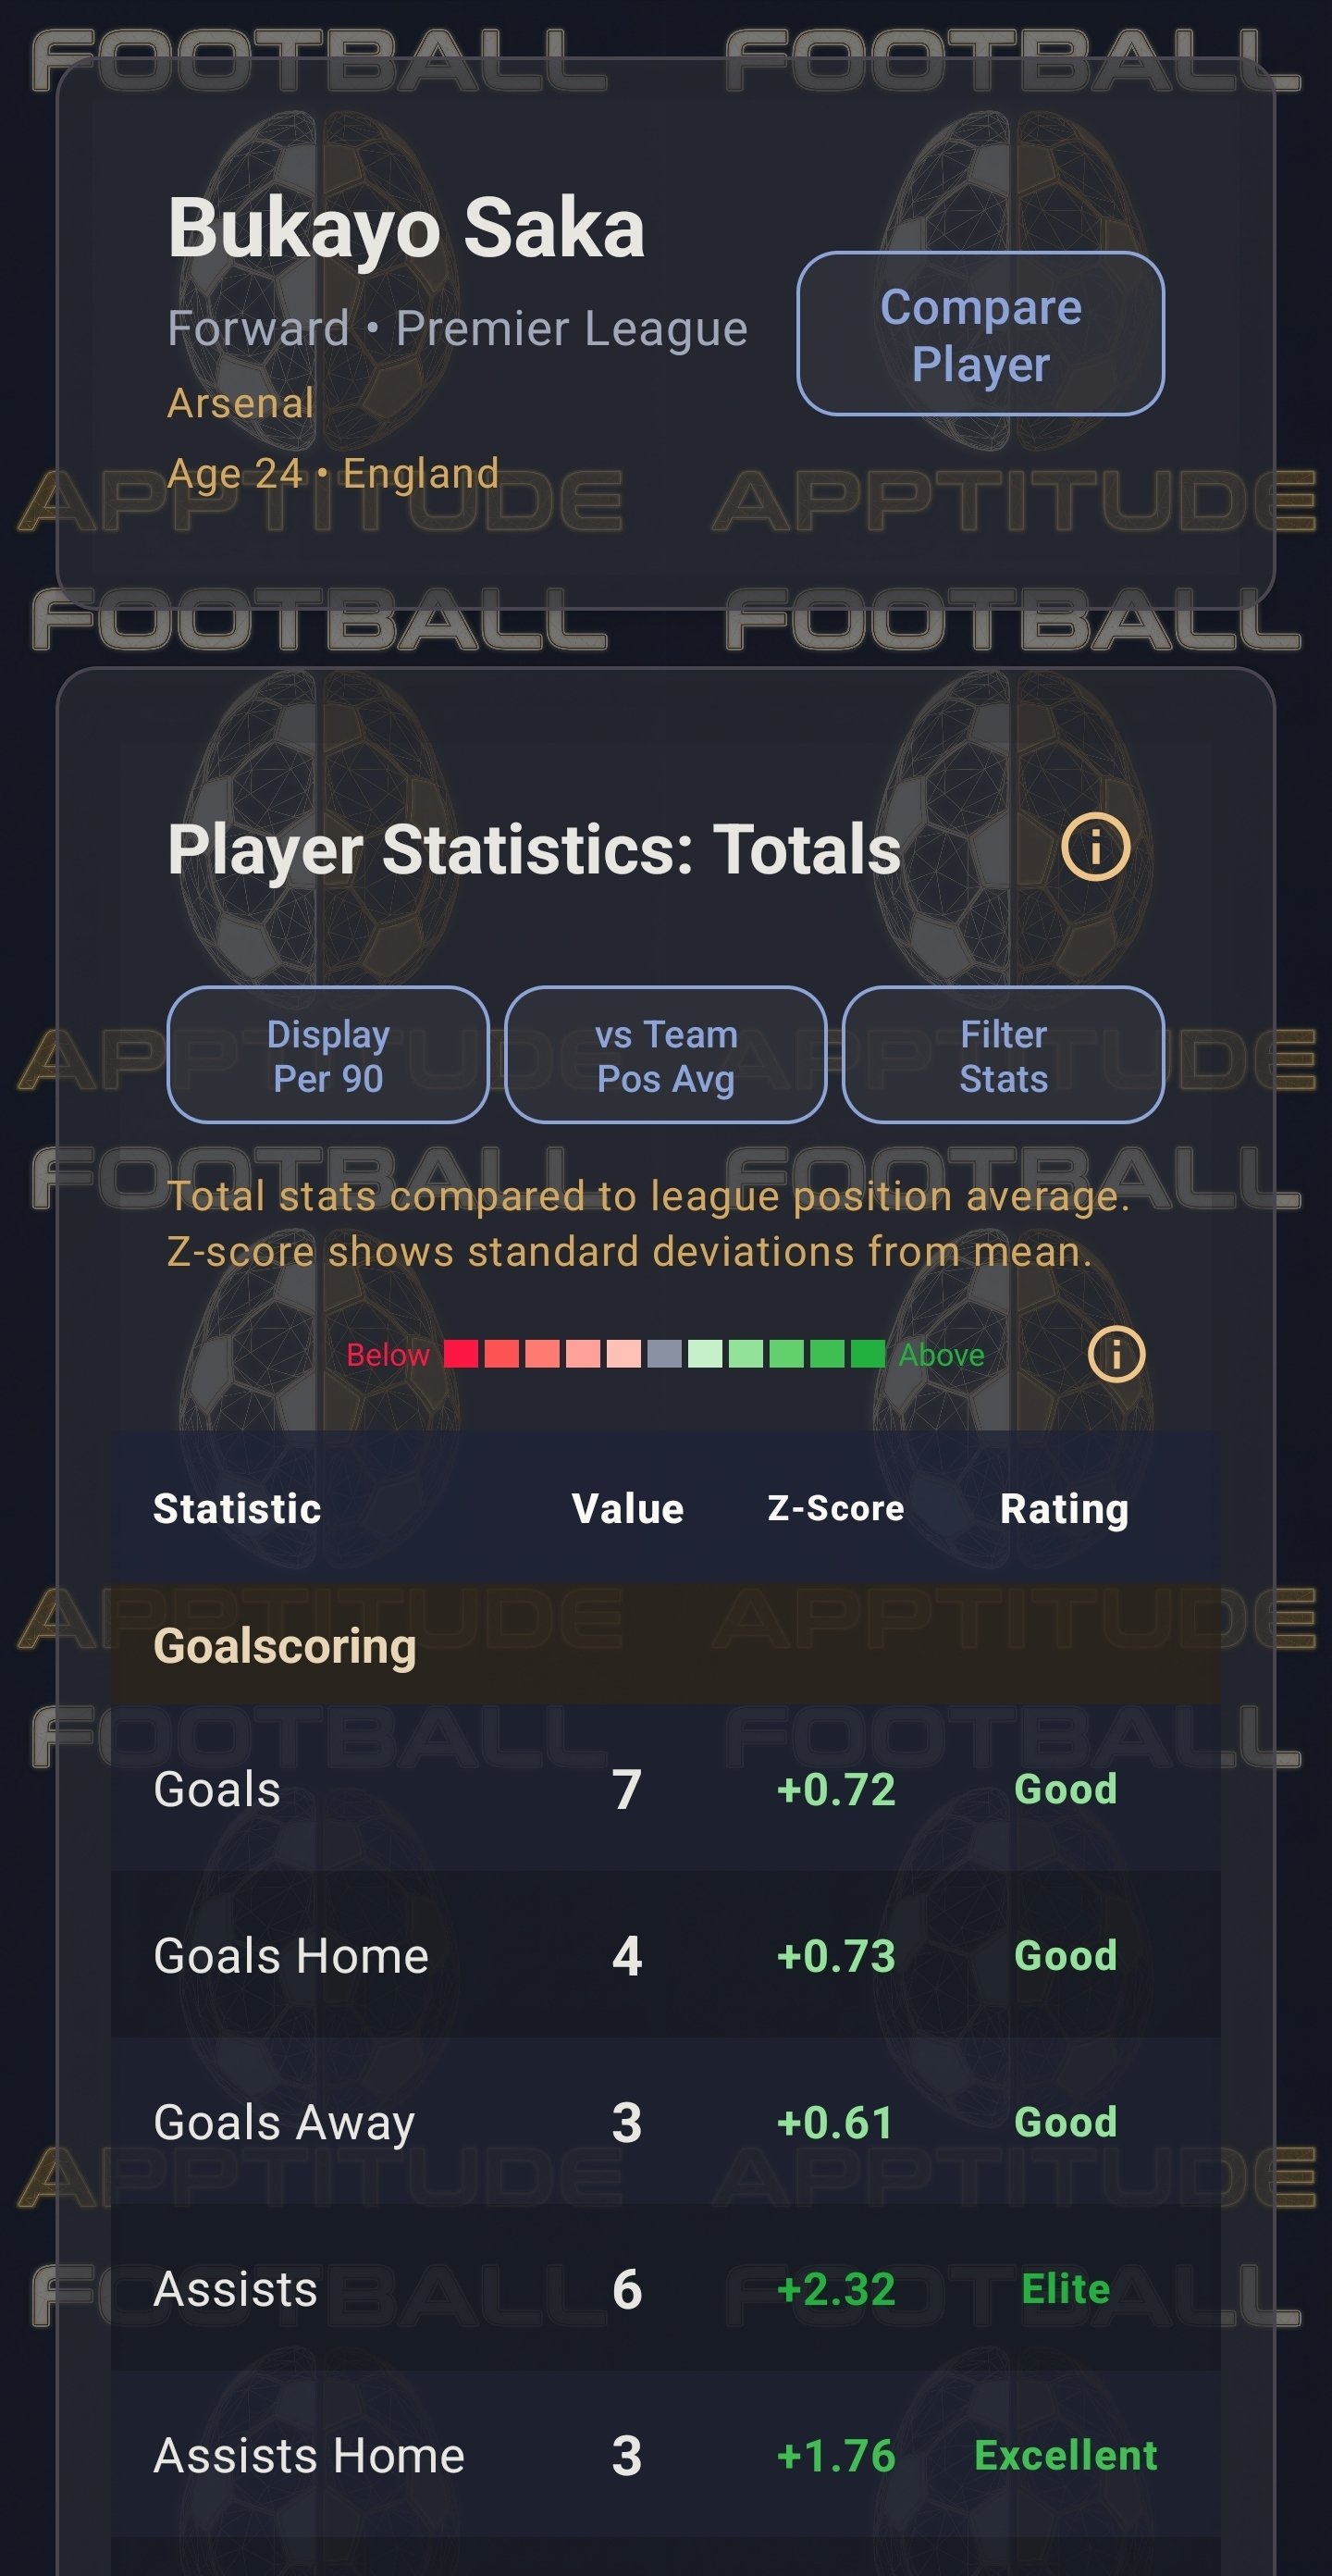
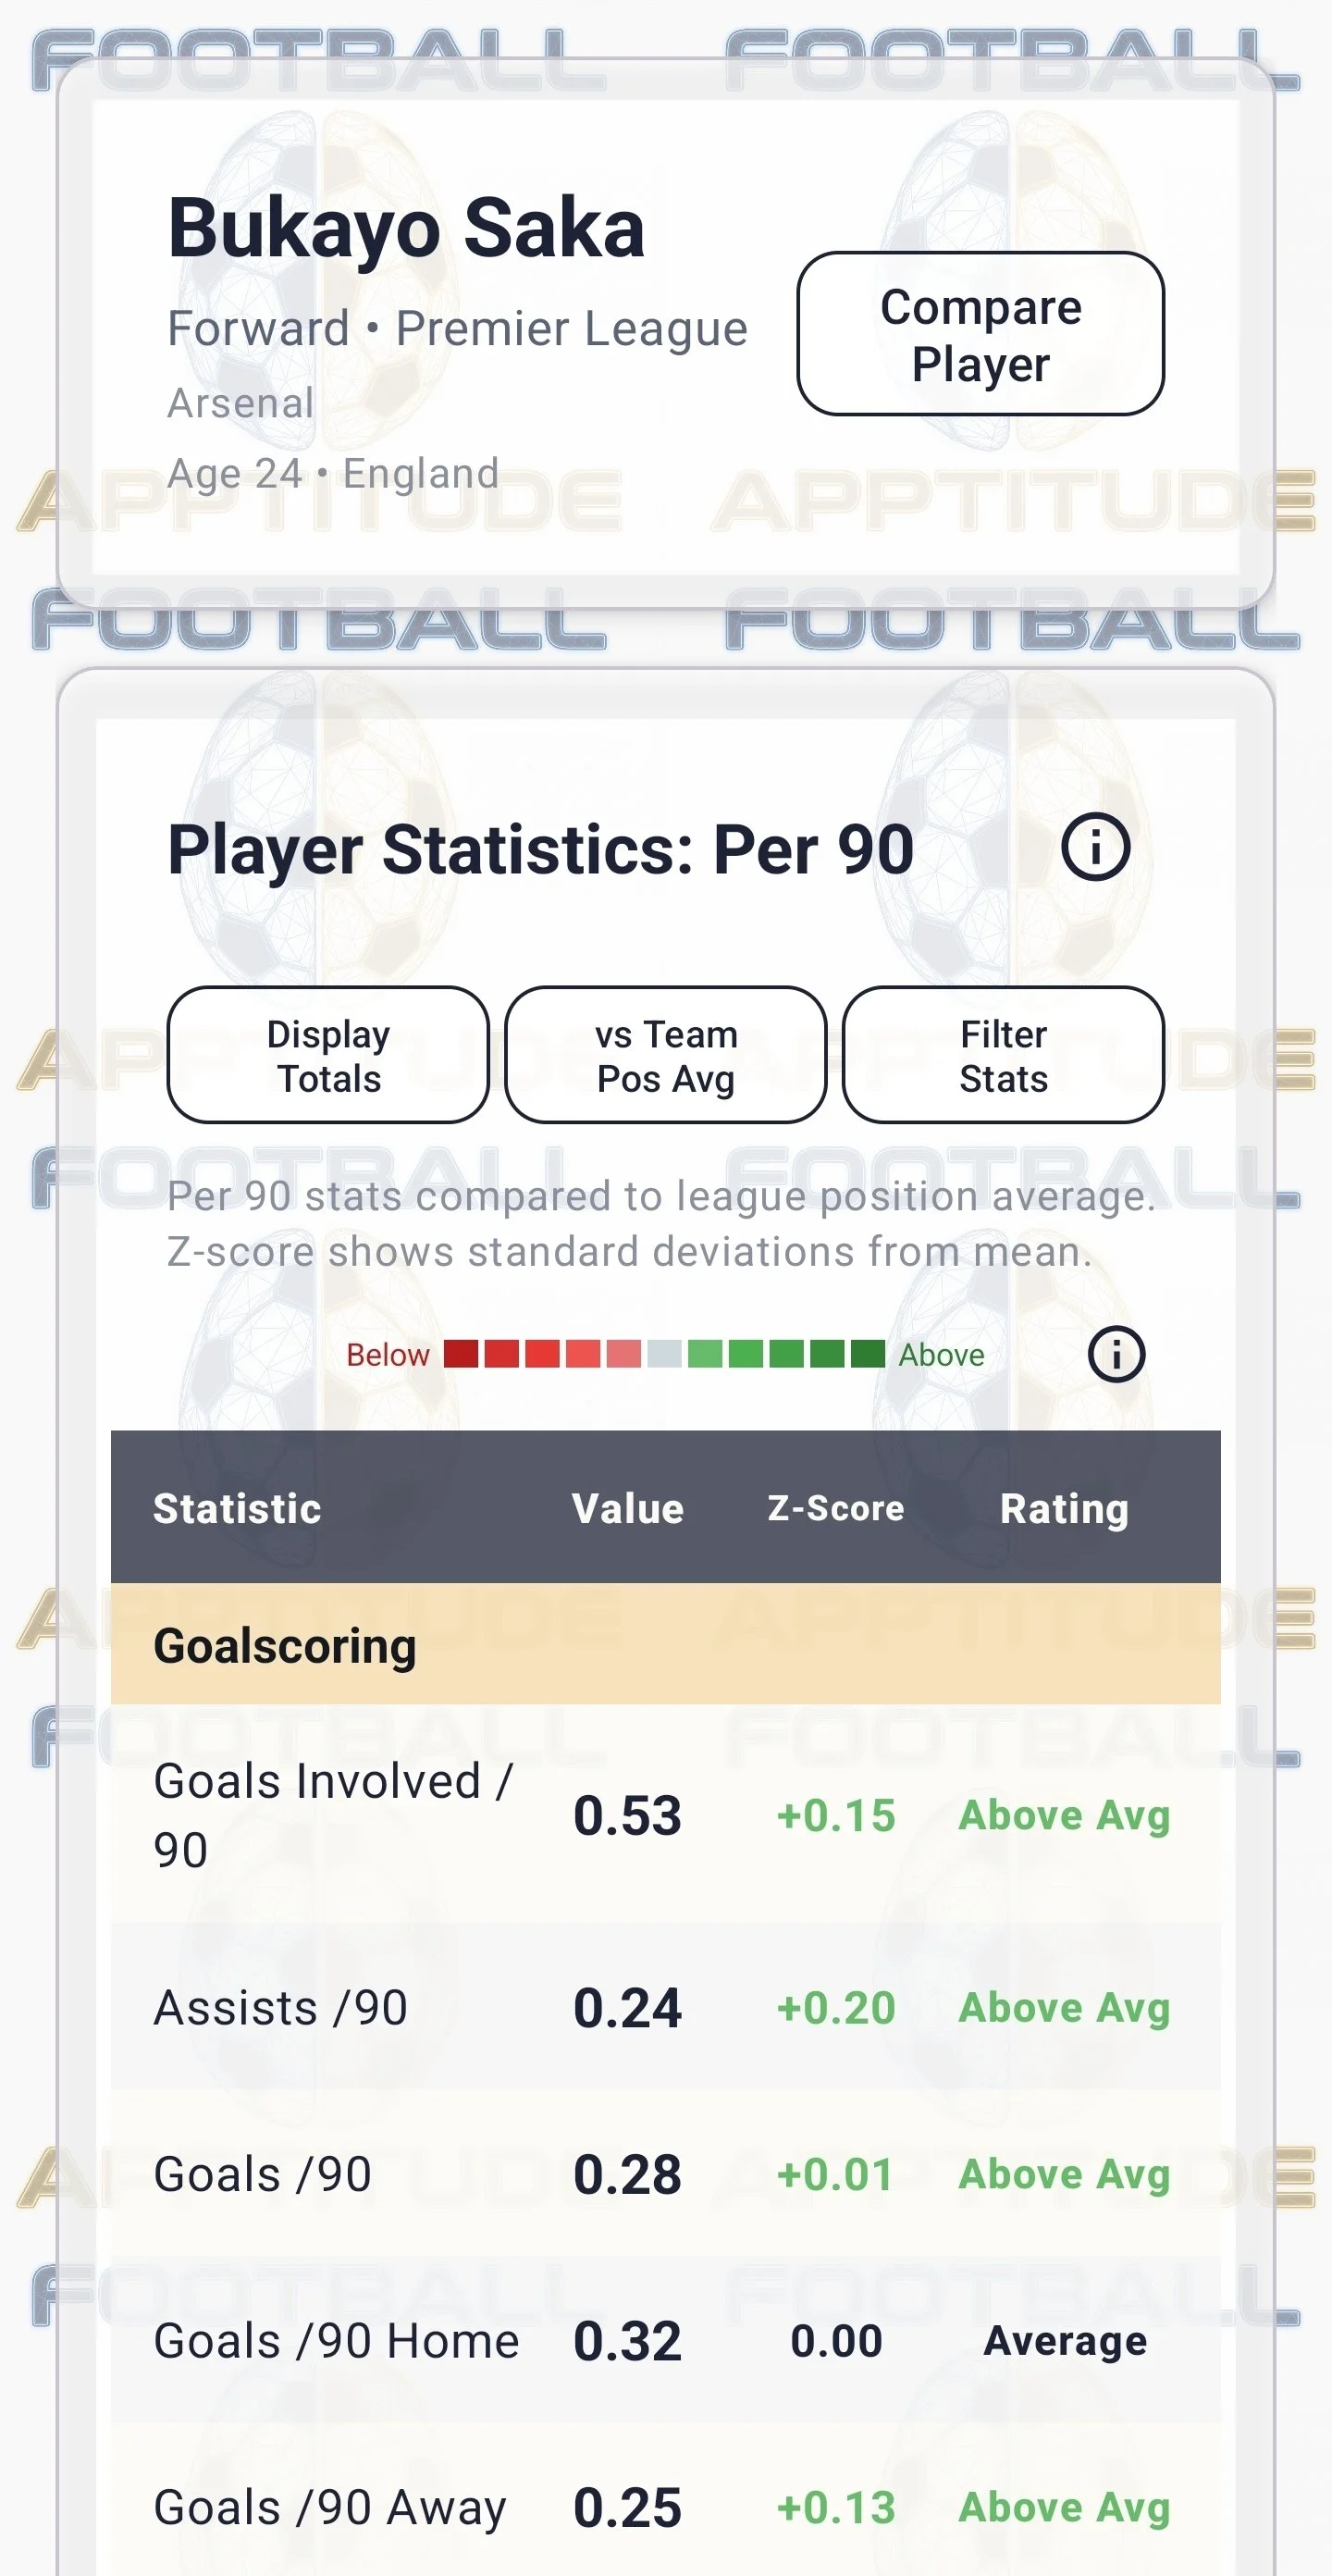
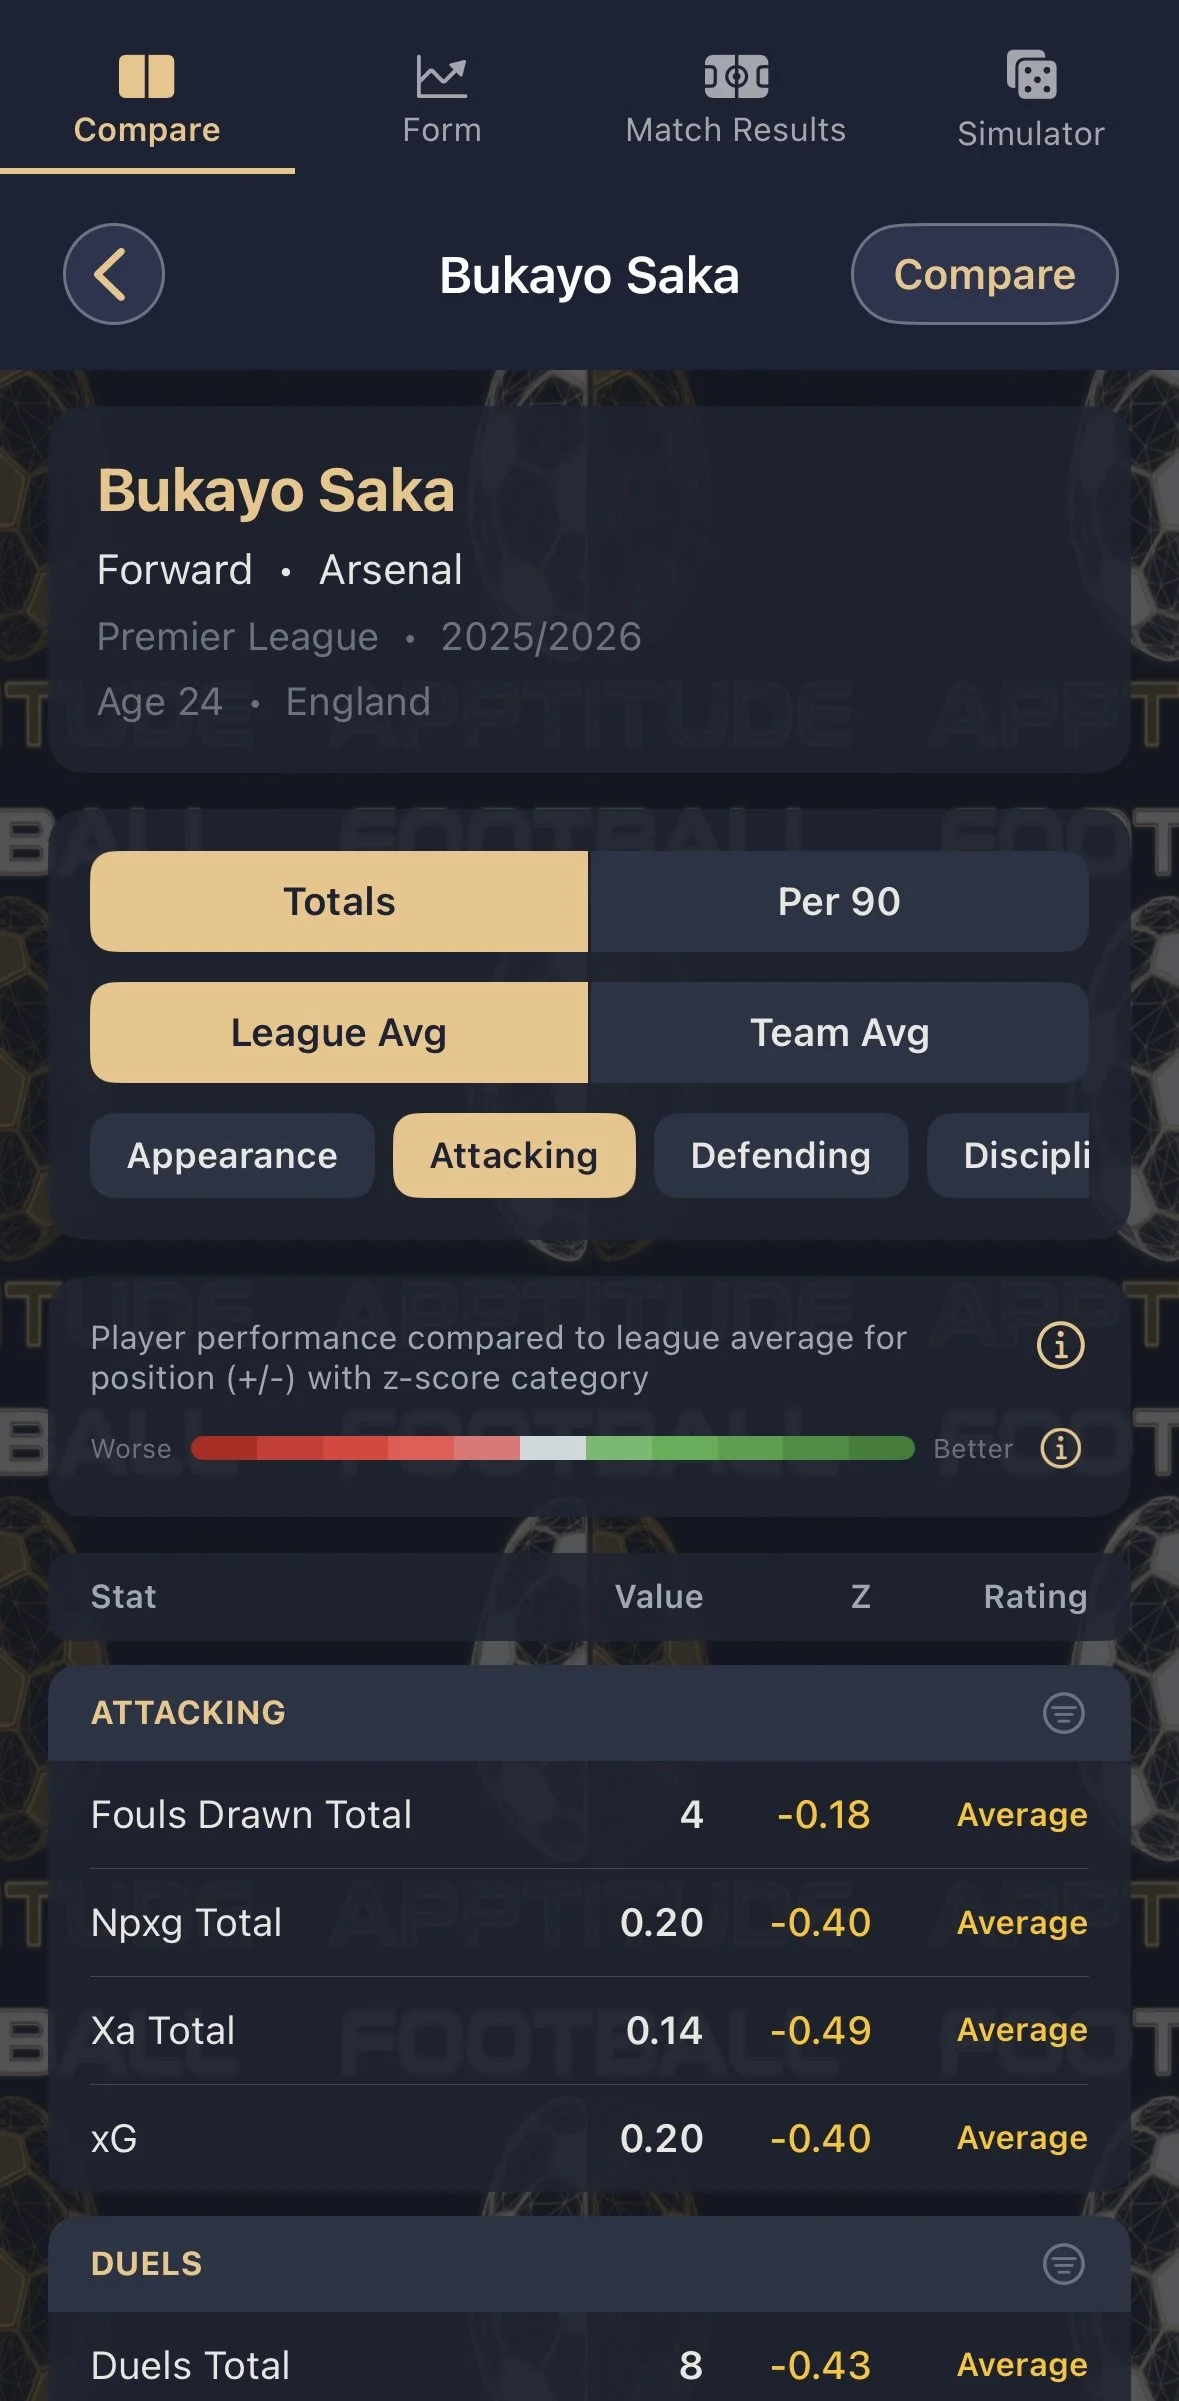
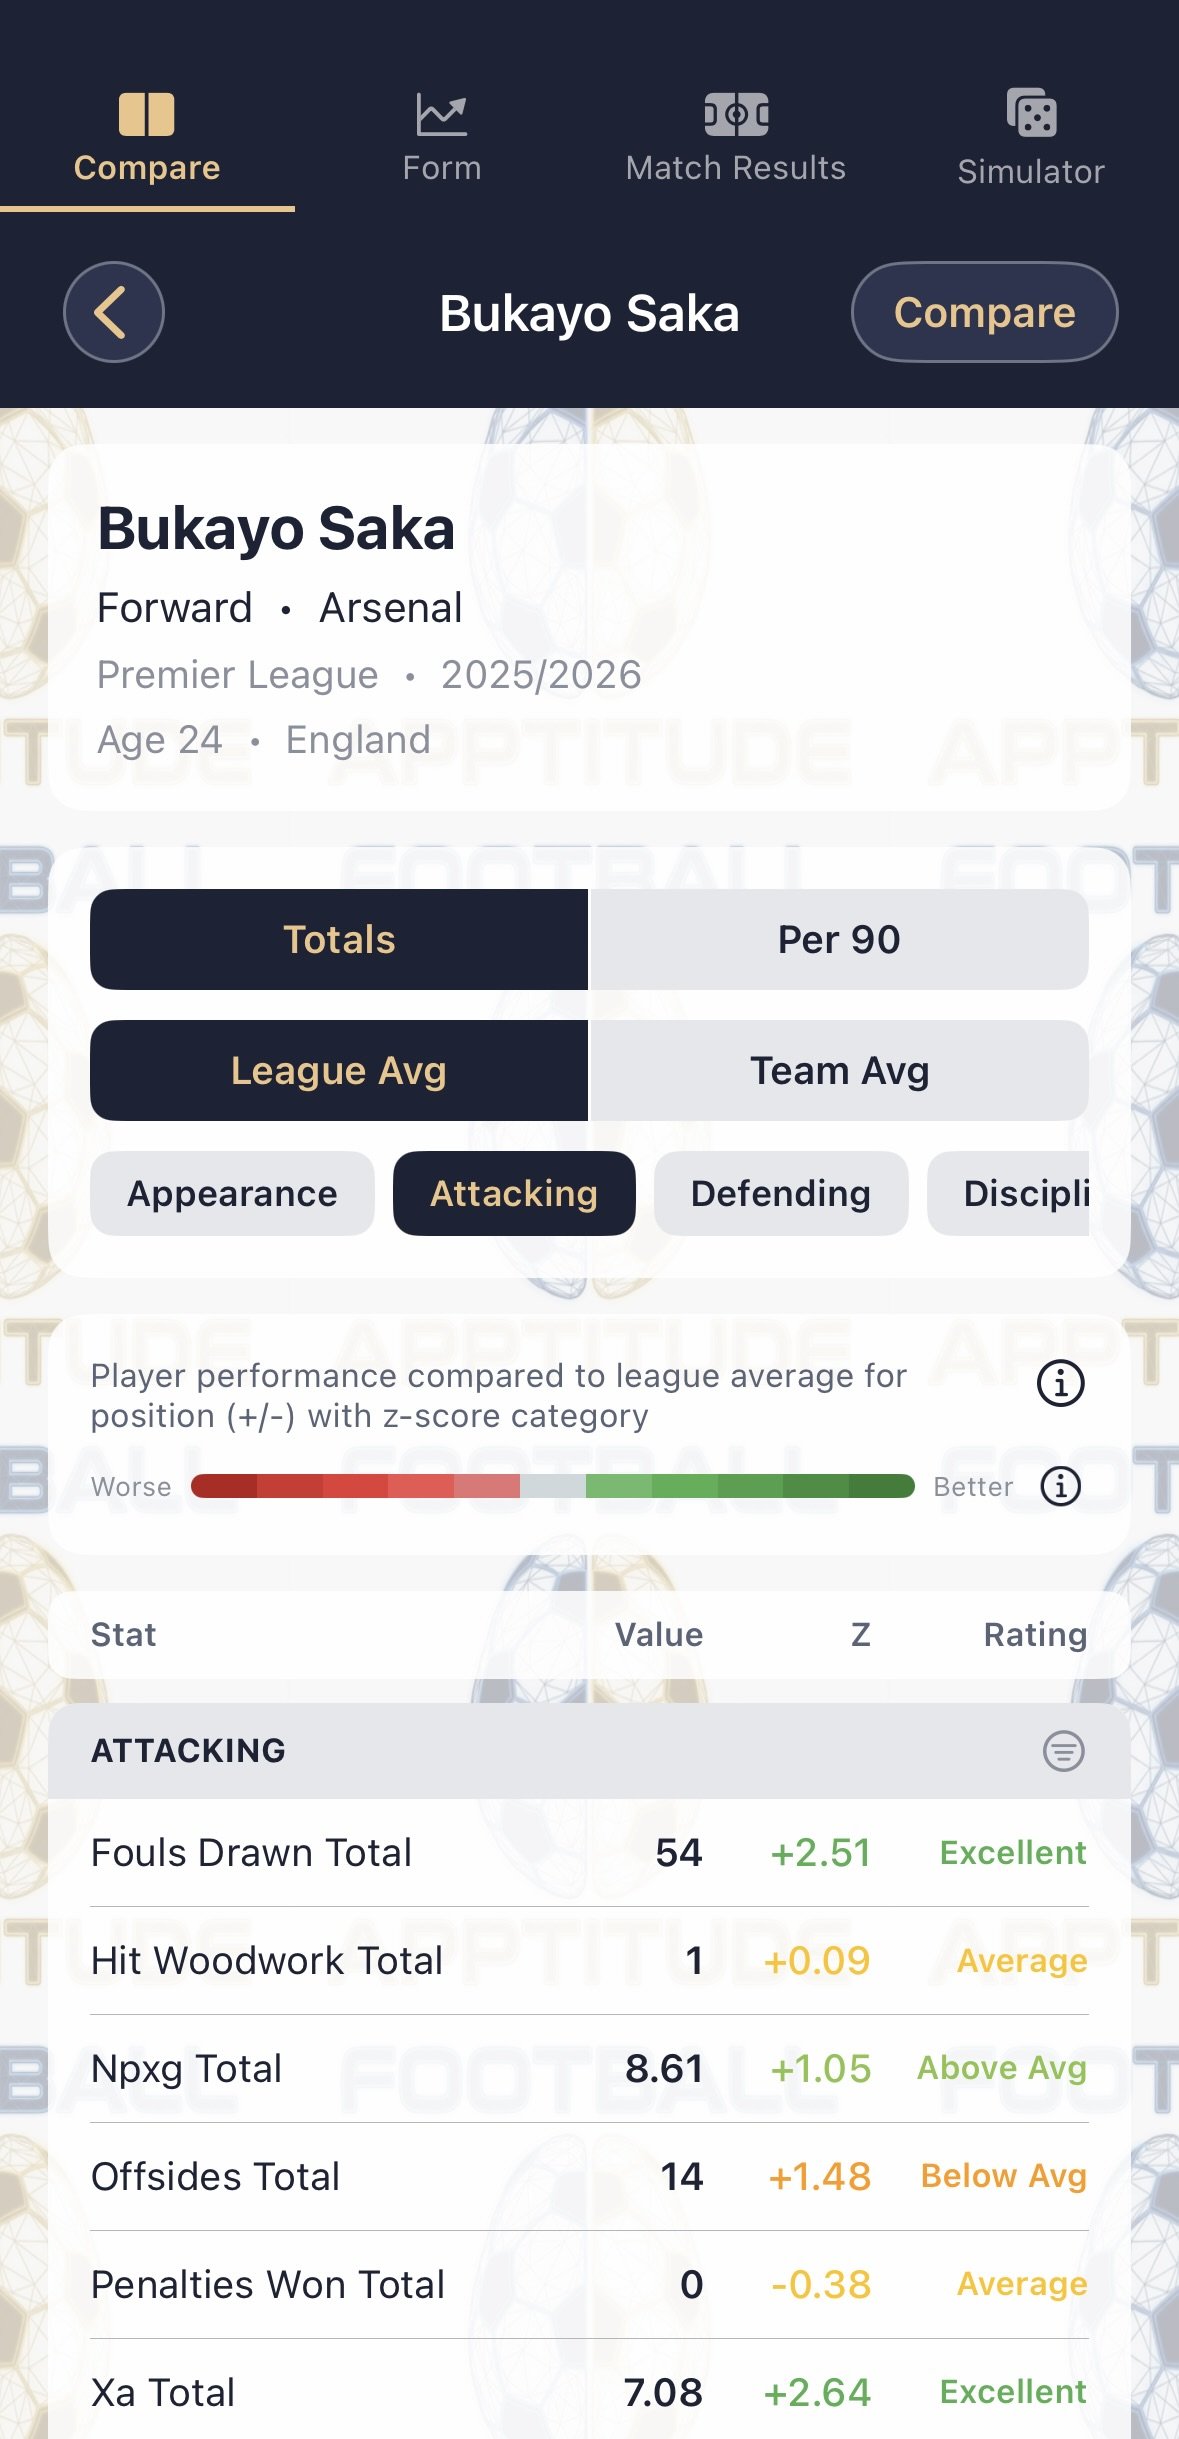
Browse detailed season statistics for players across all covered leagues. Toggle between season totals and per-90 min adjustments.
-
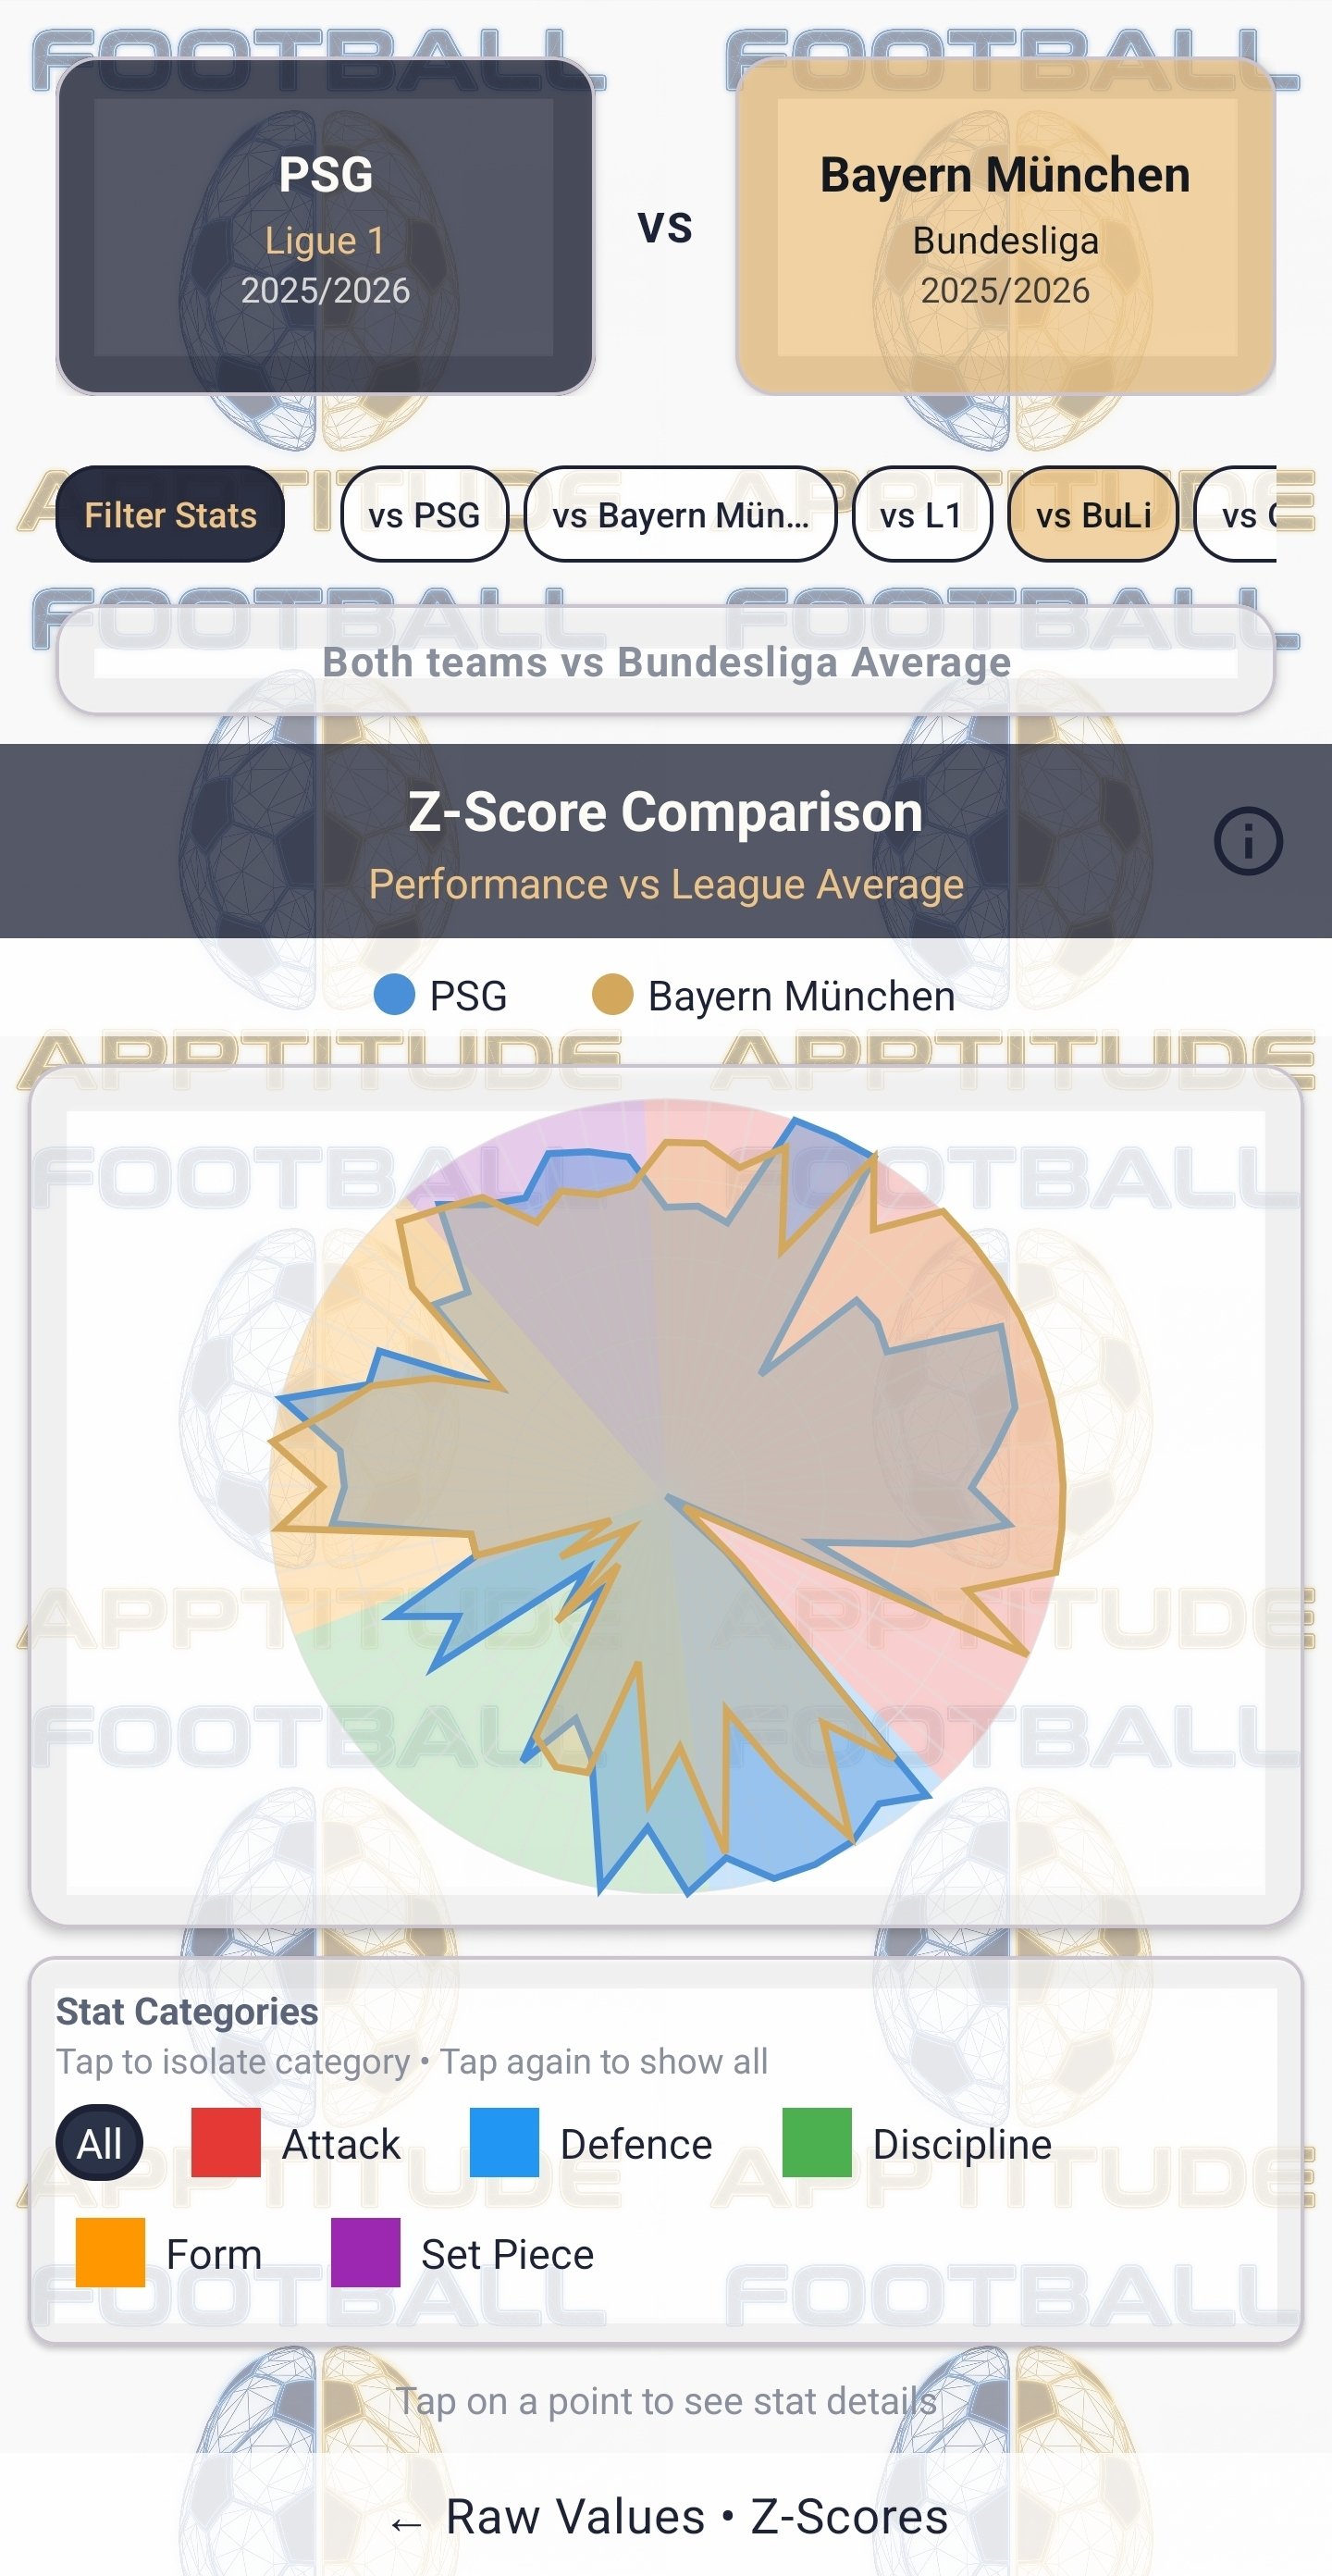
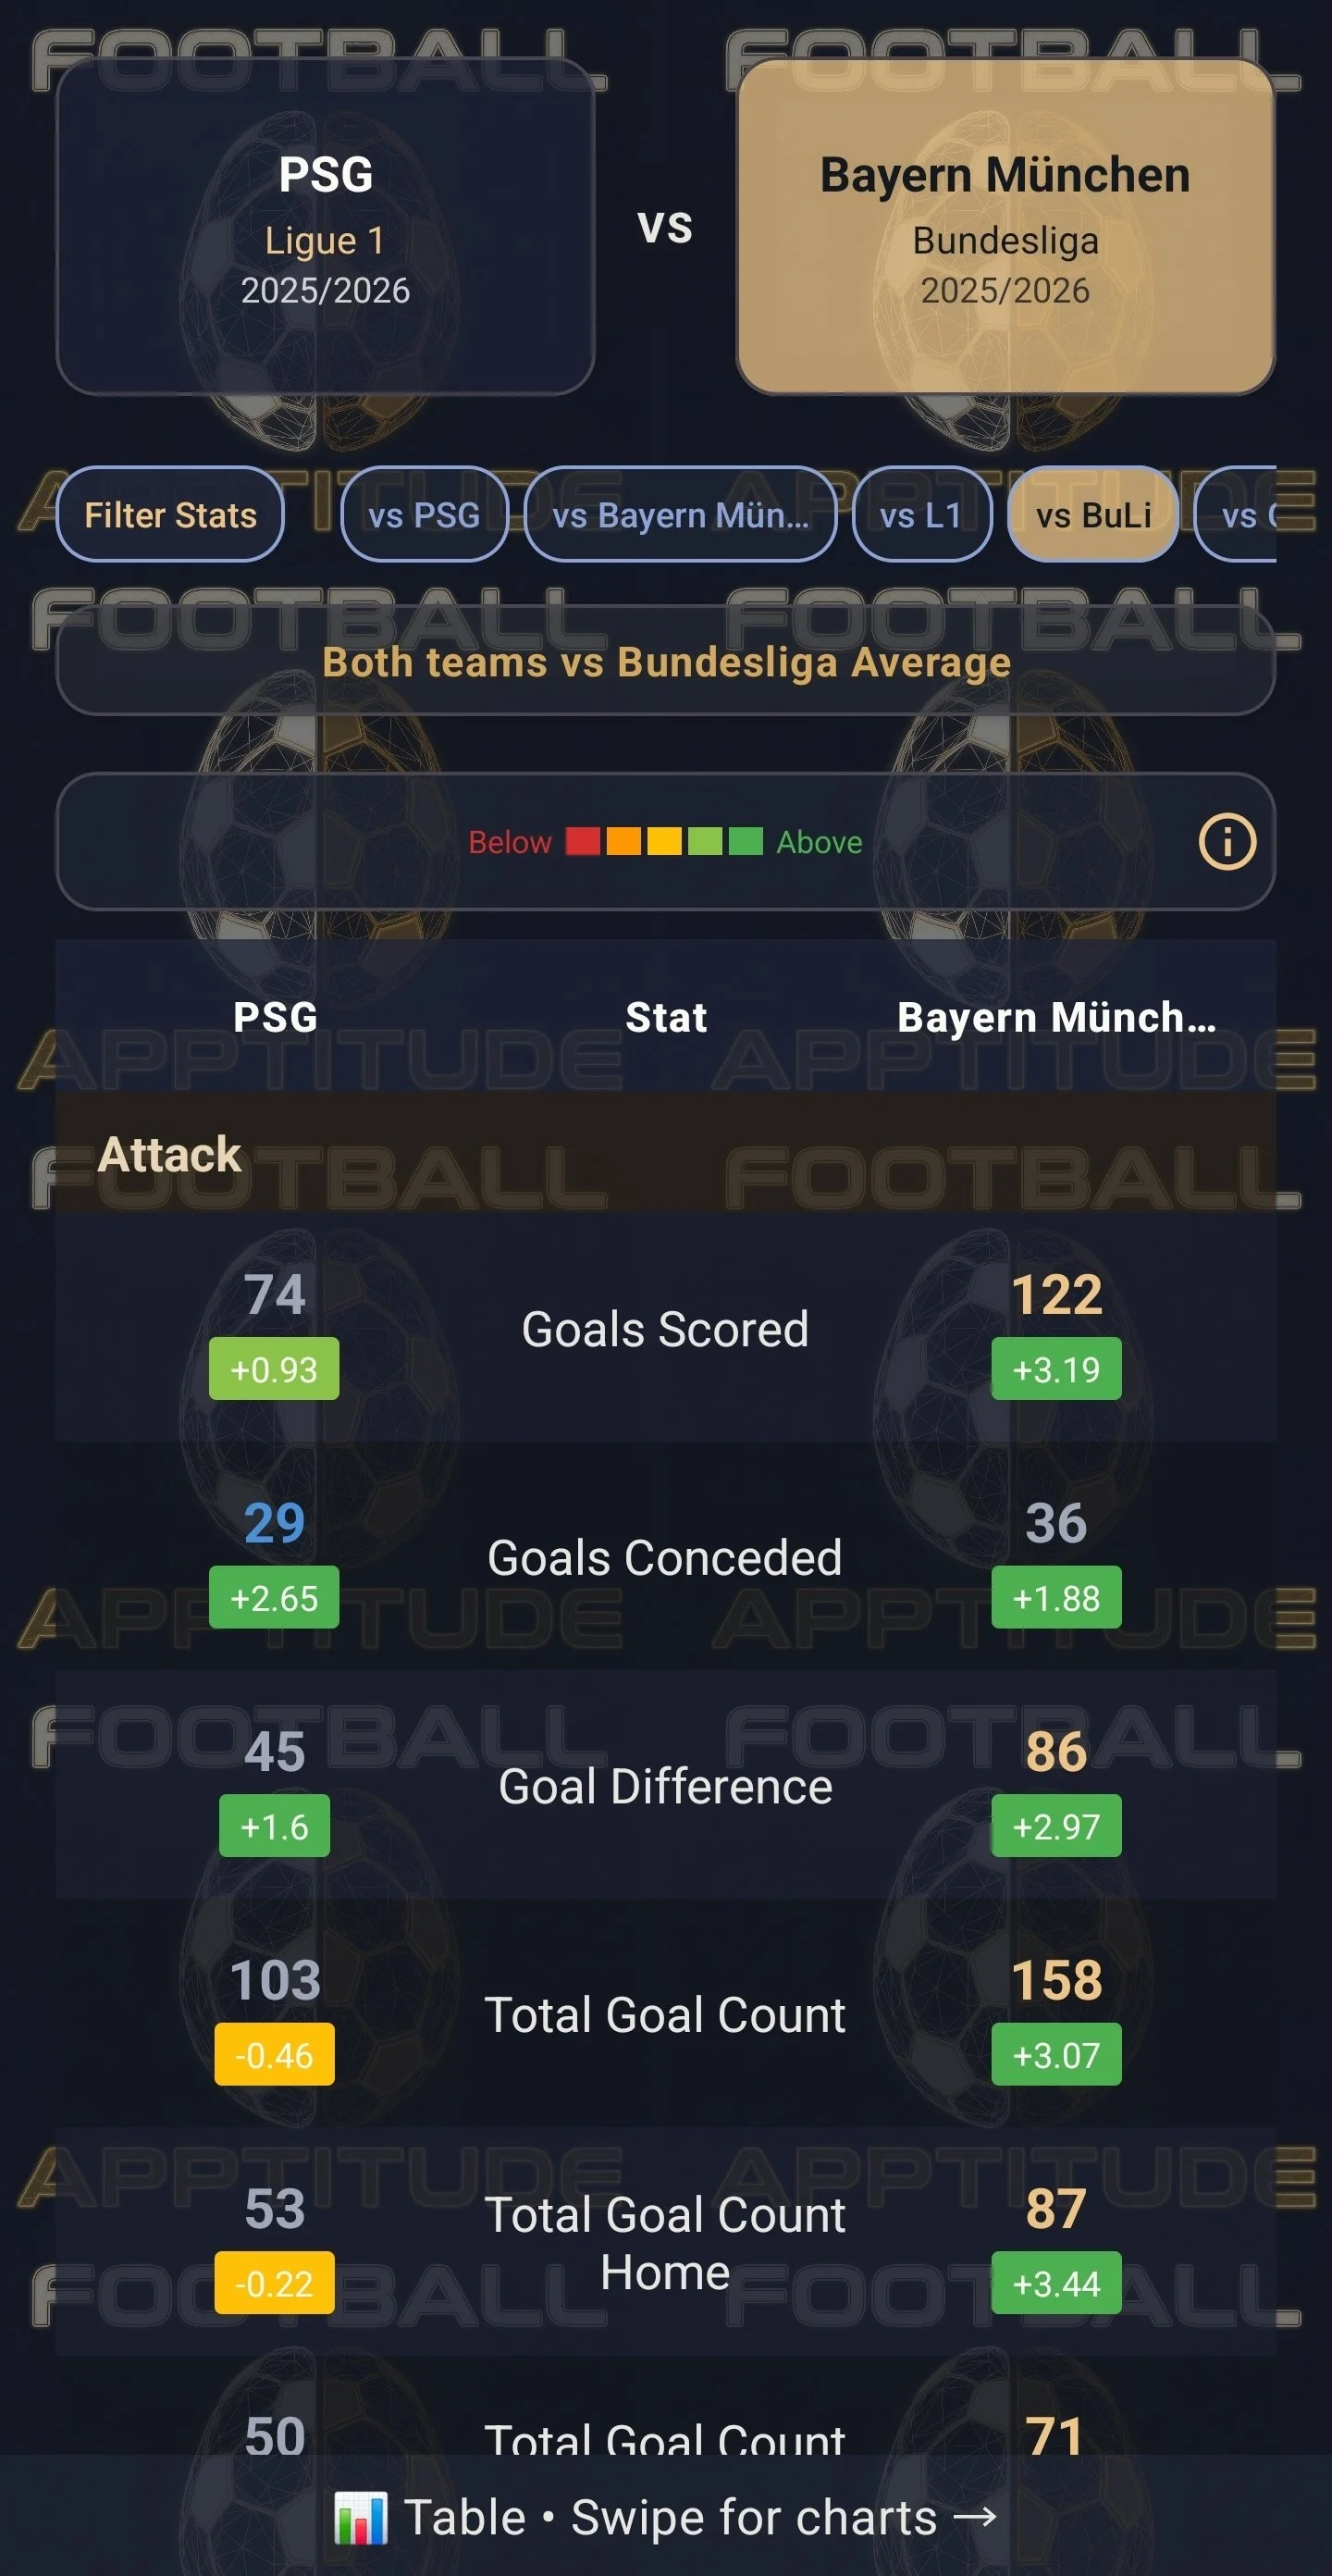
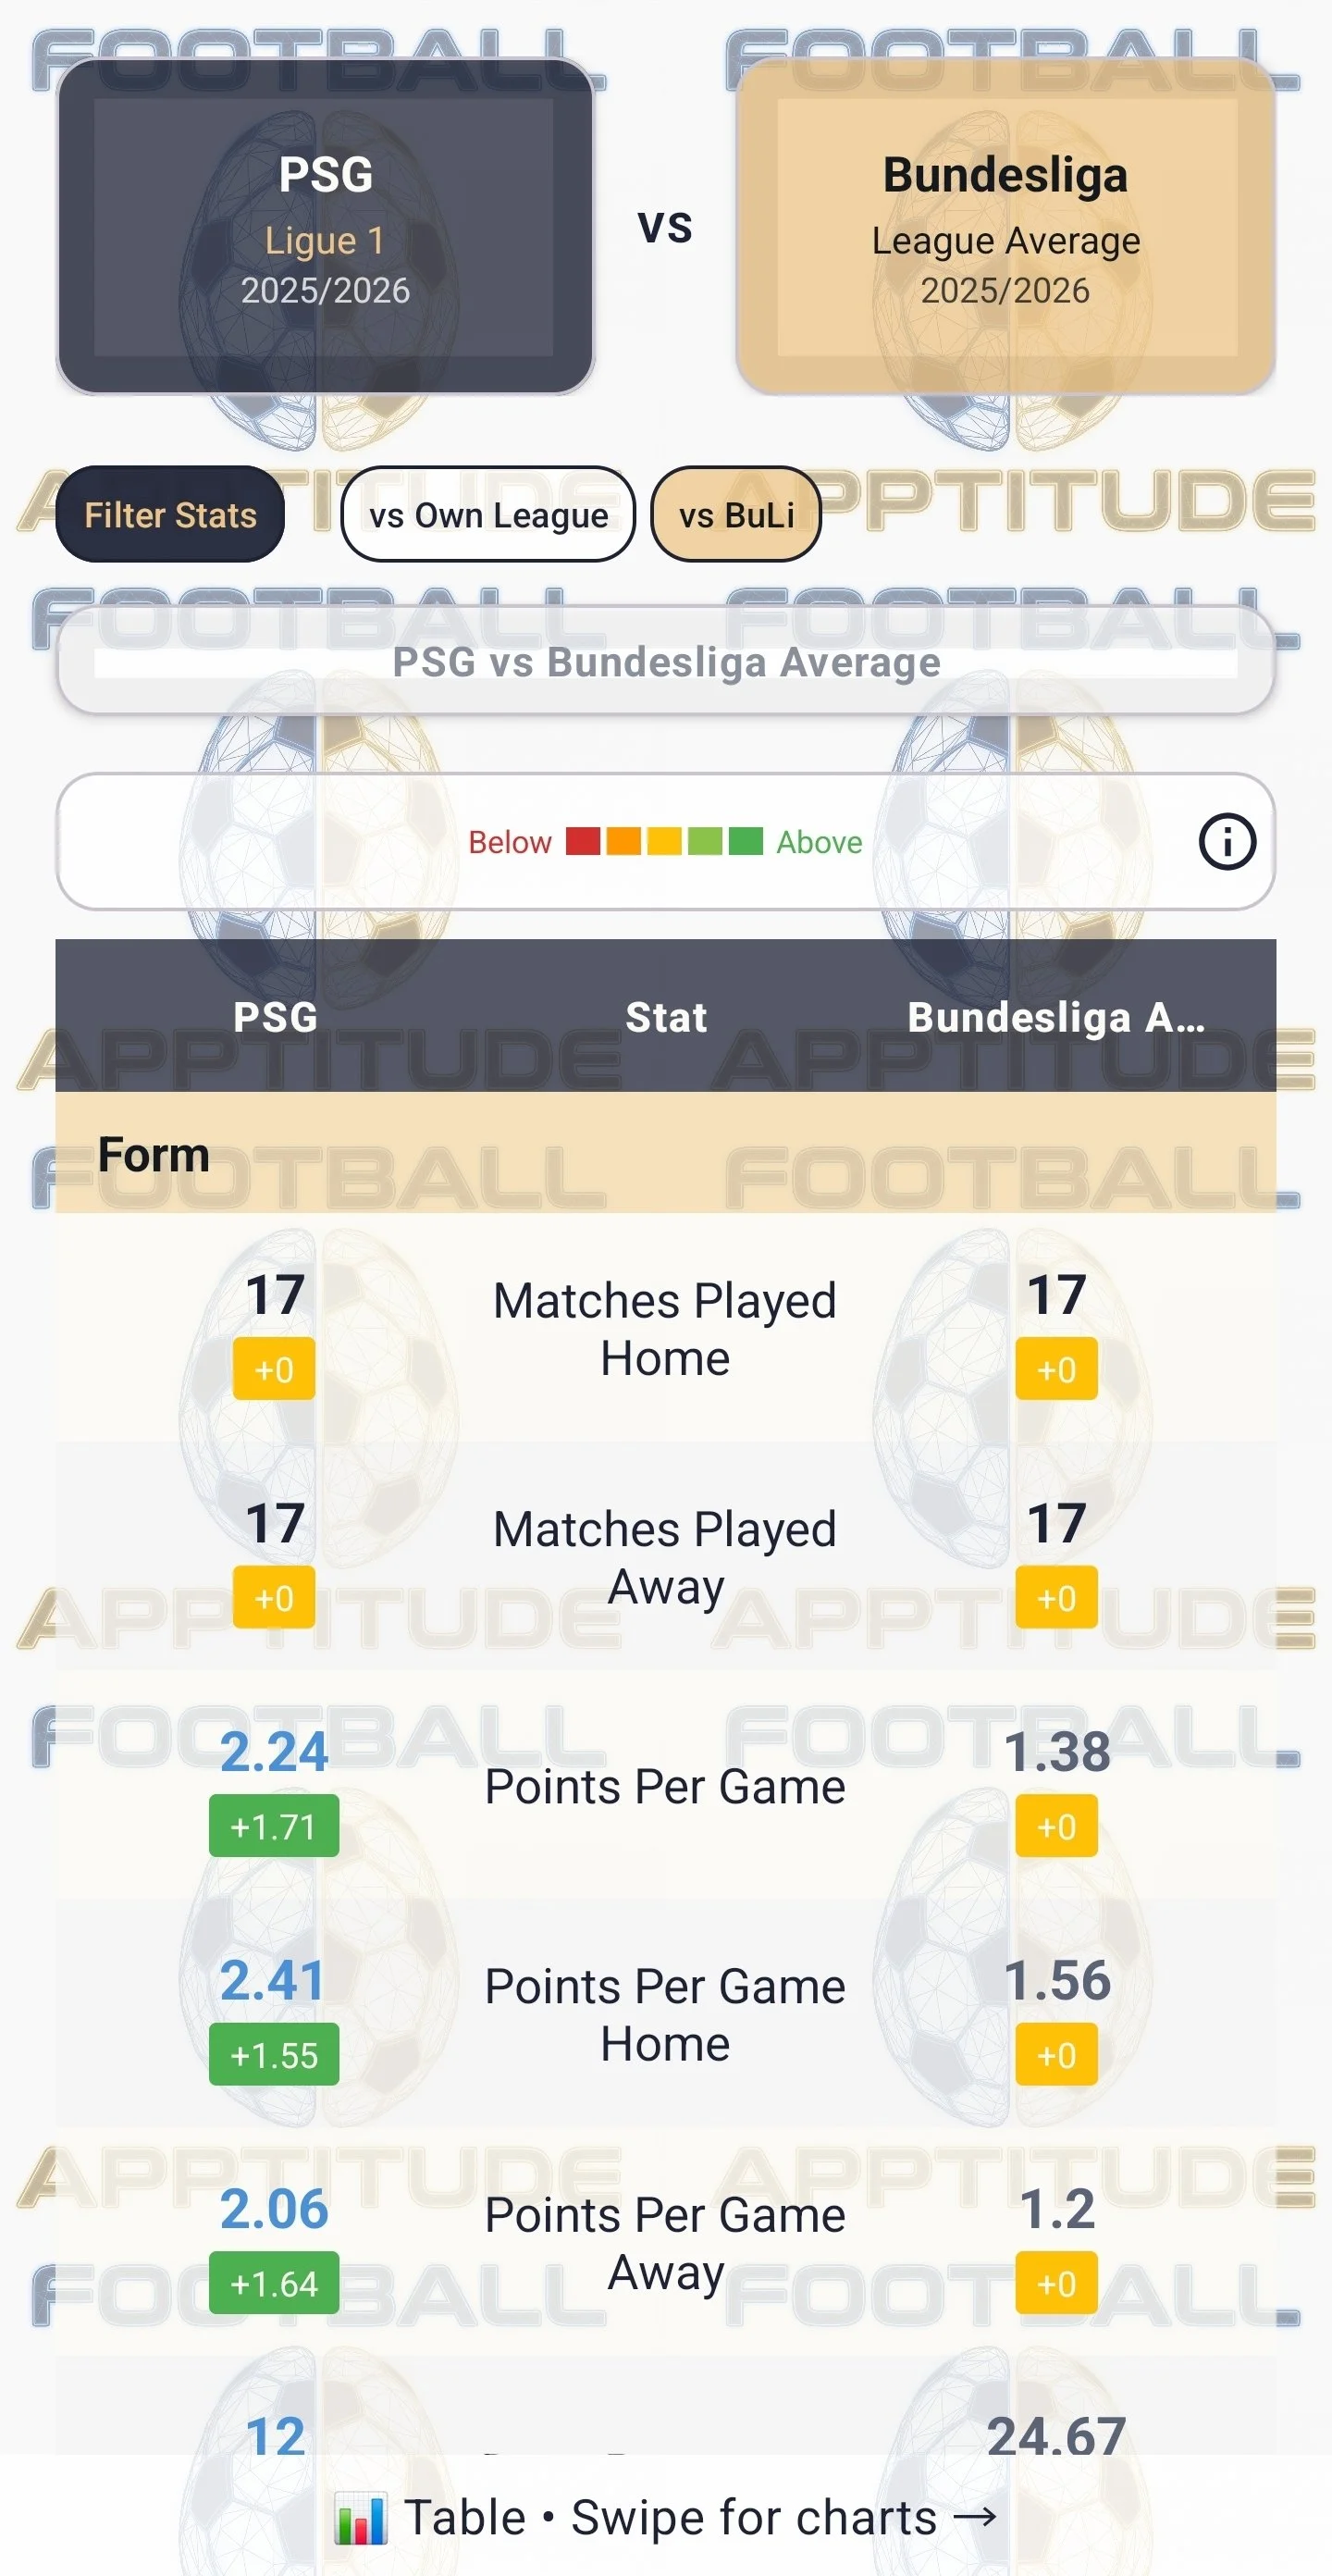
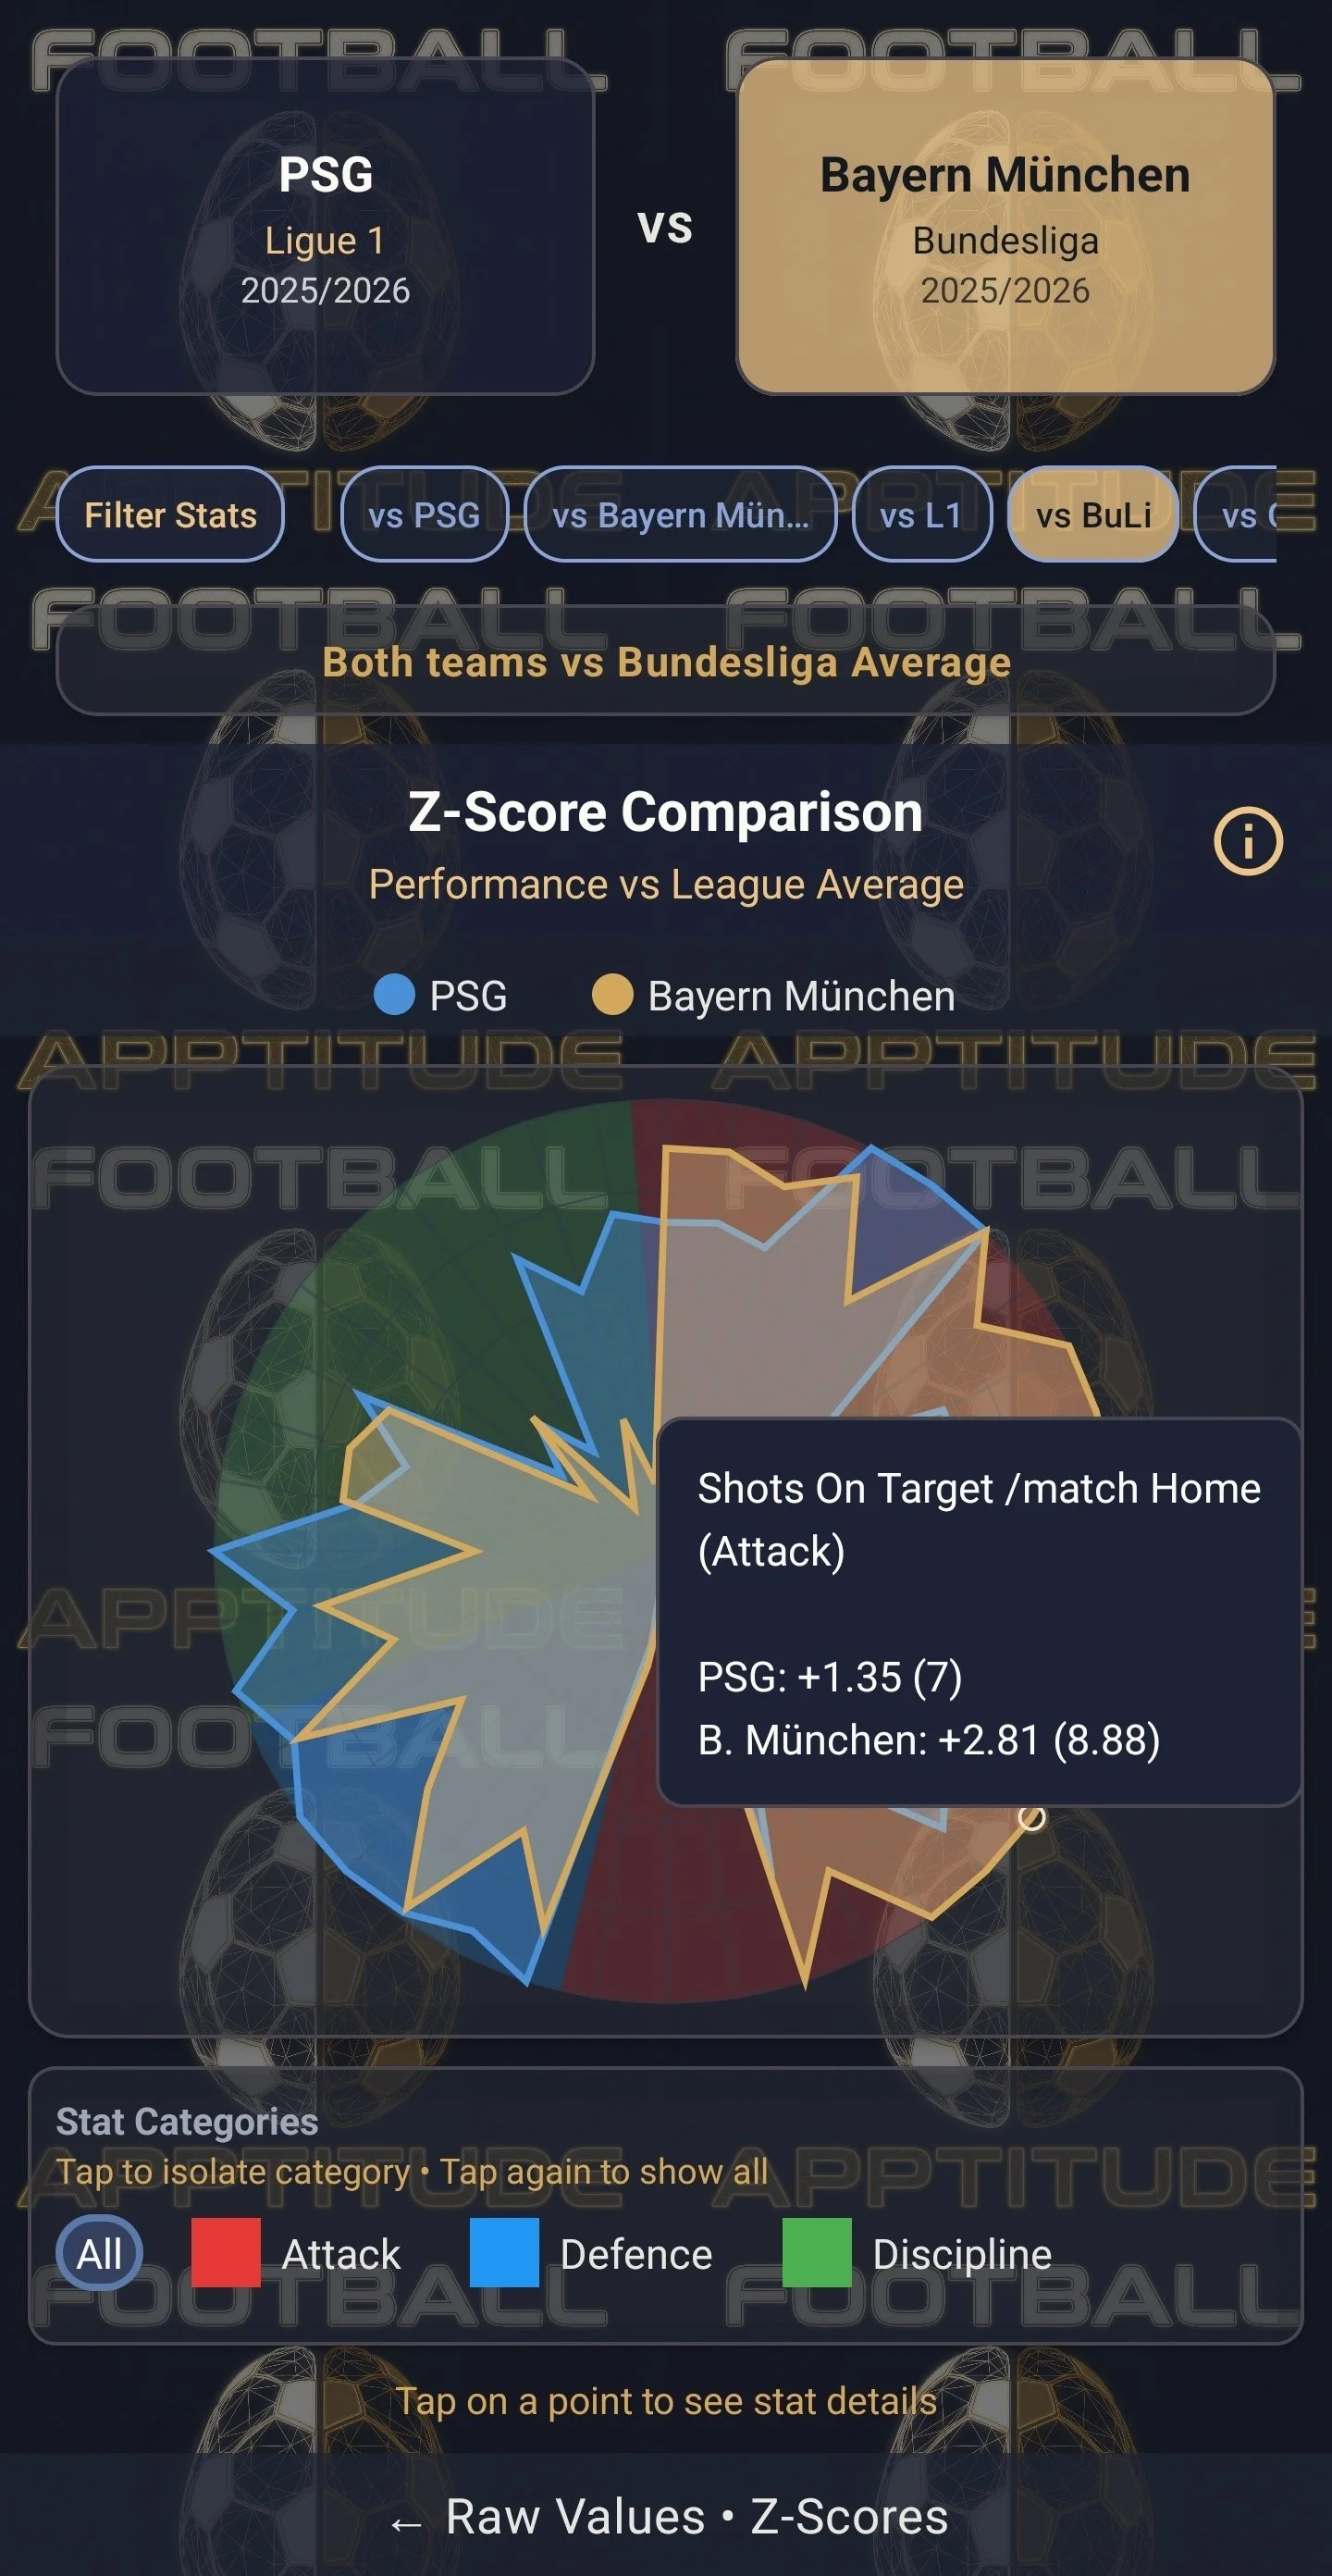
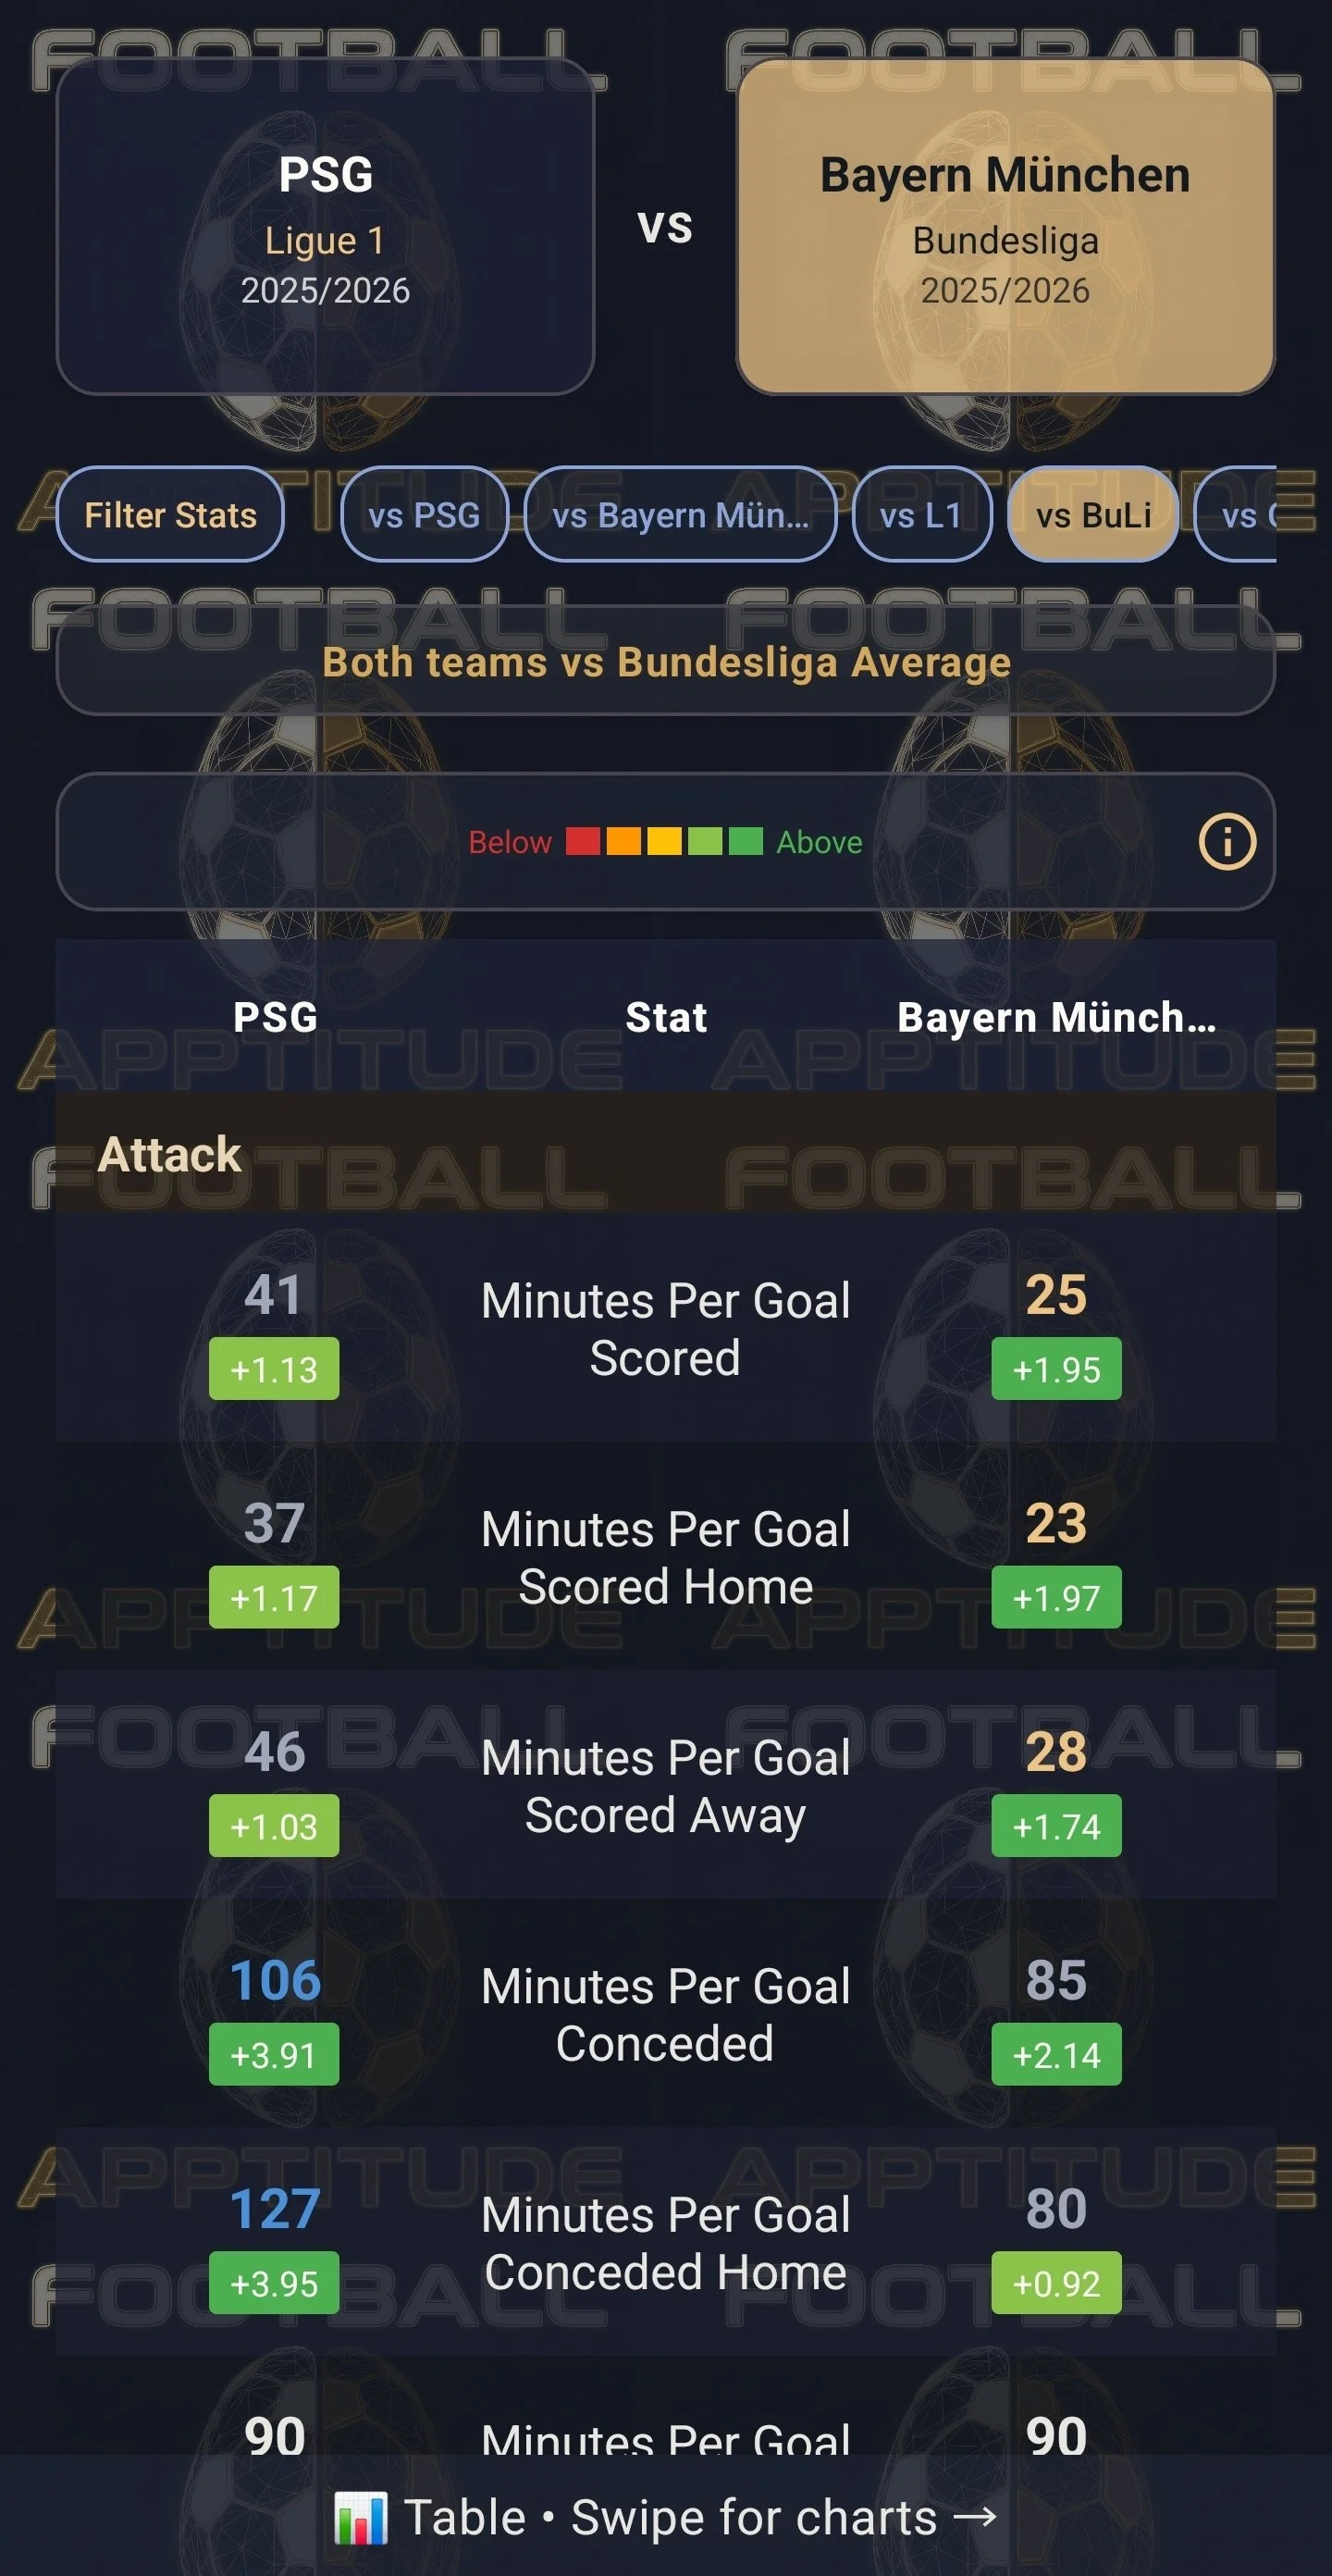
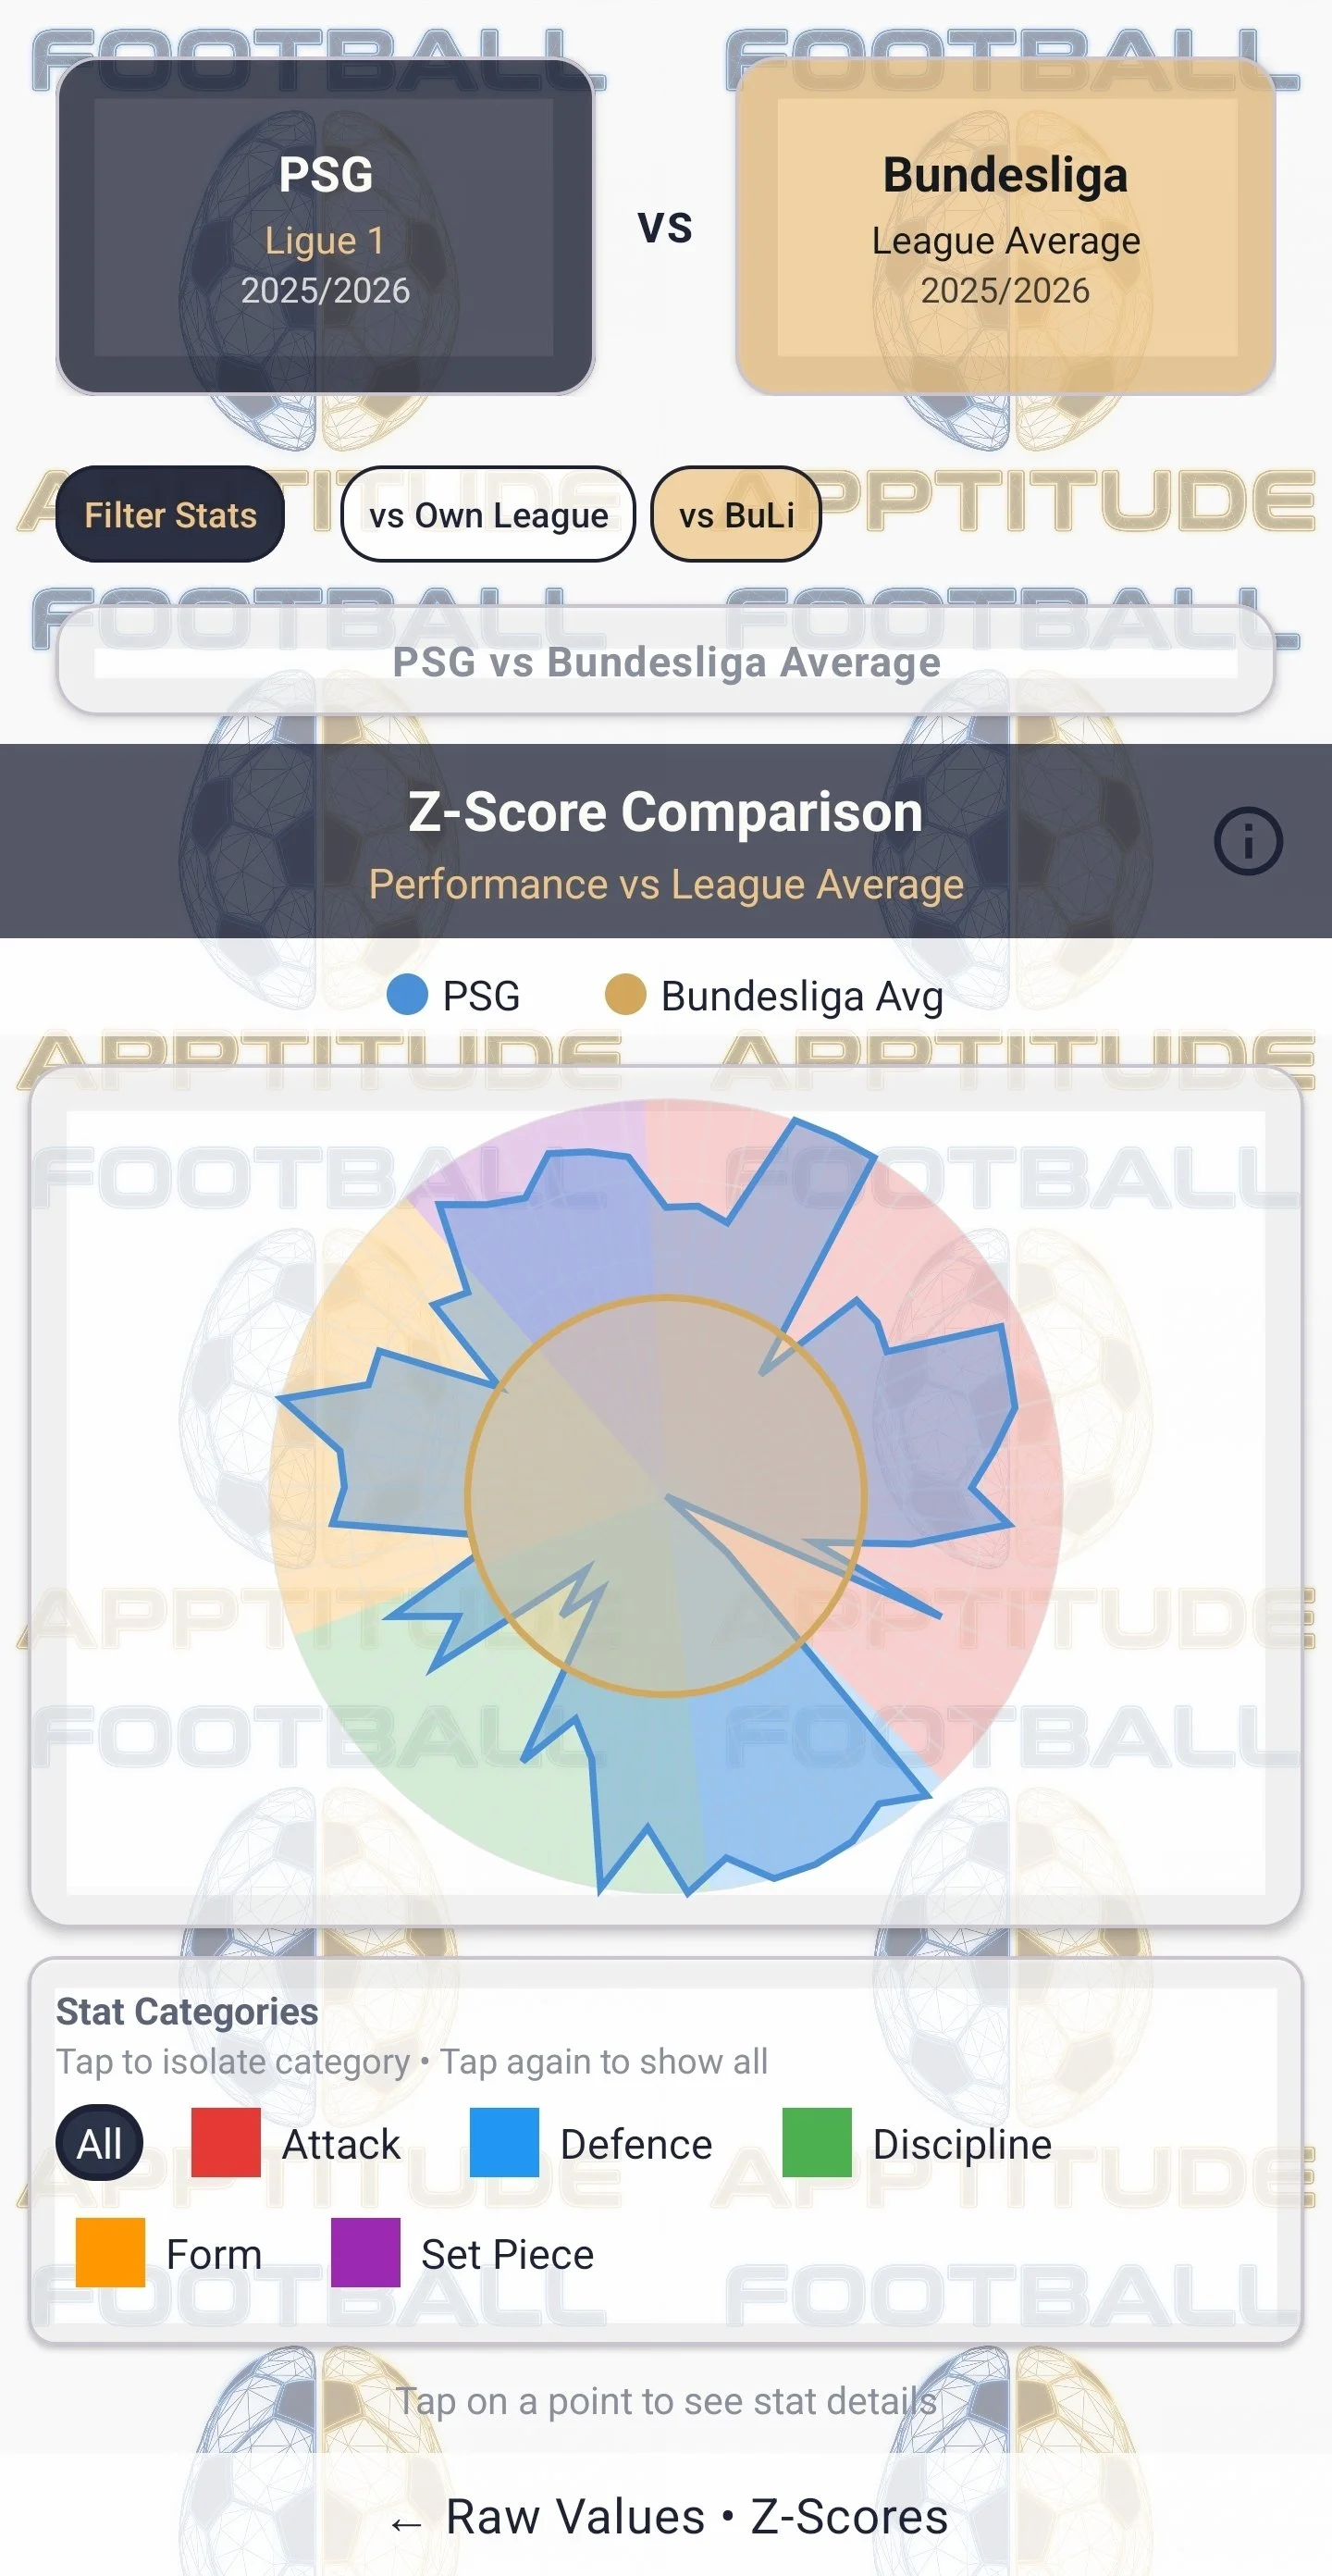
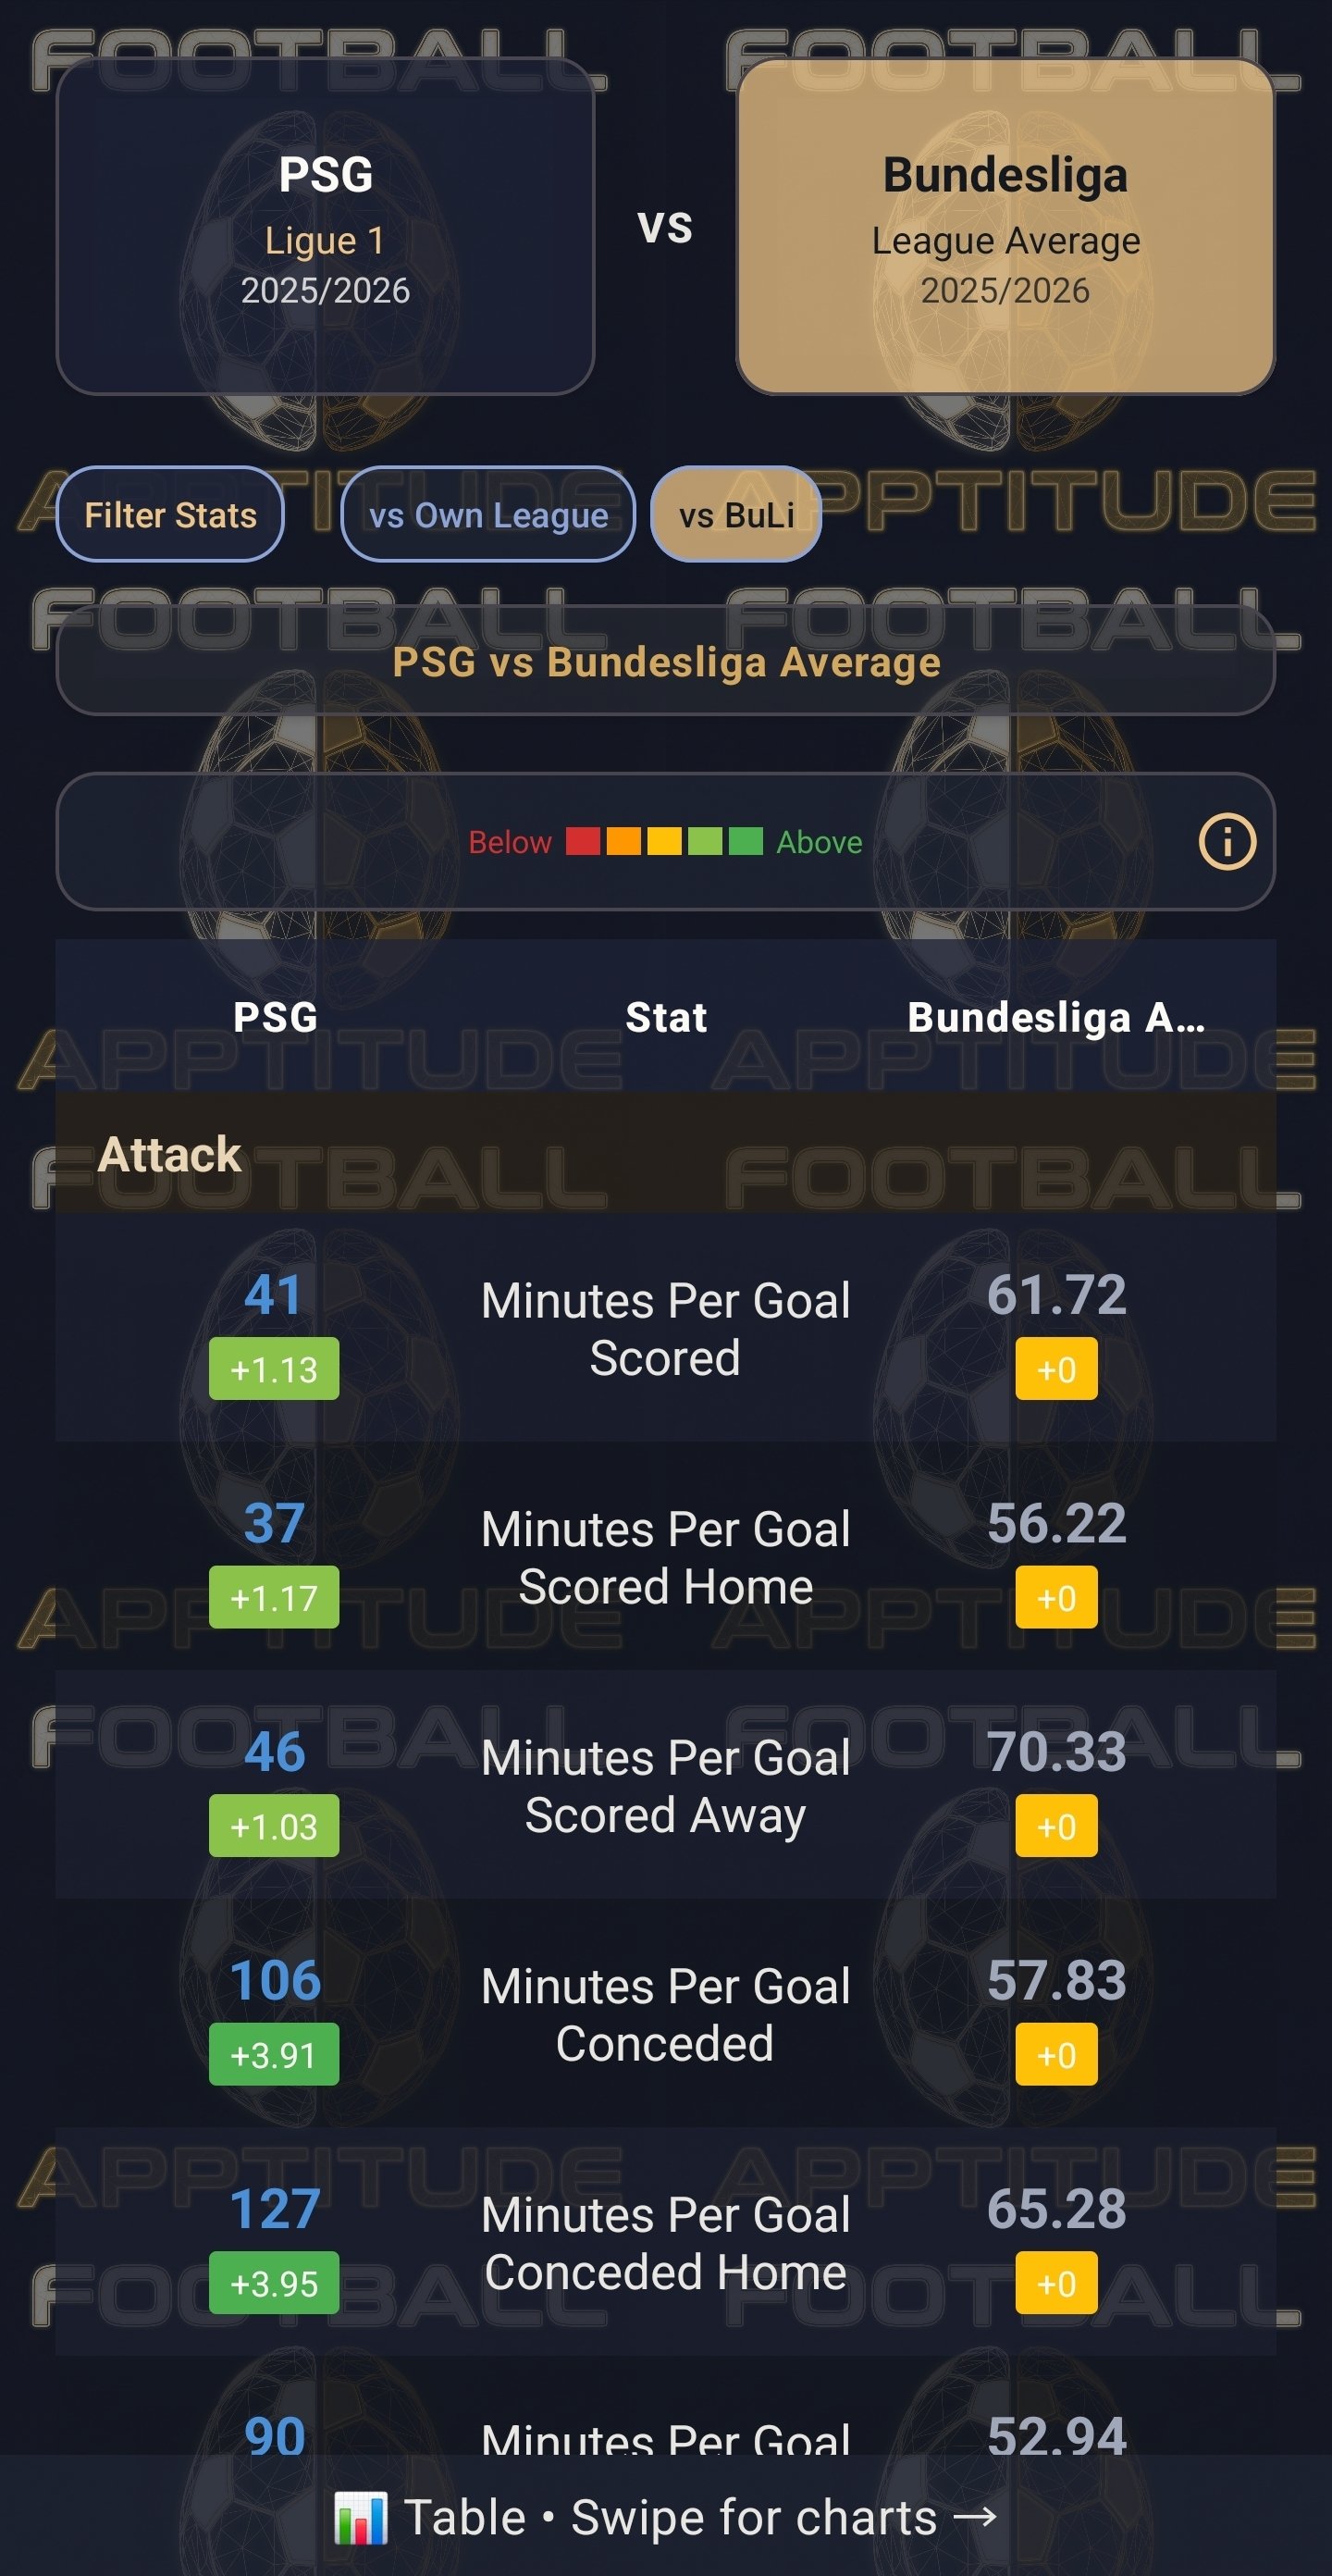
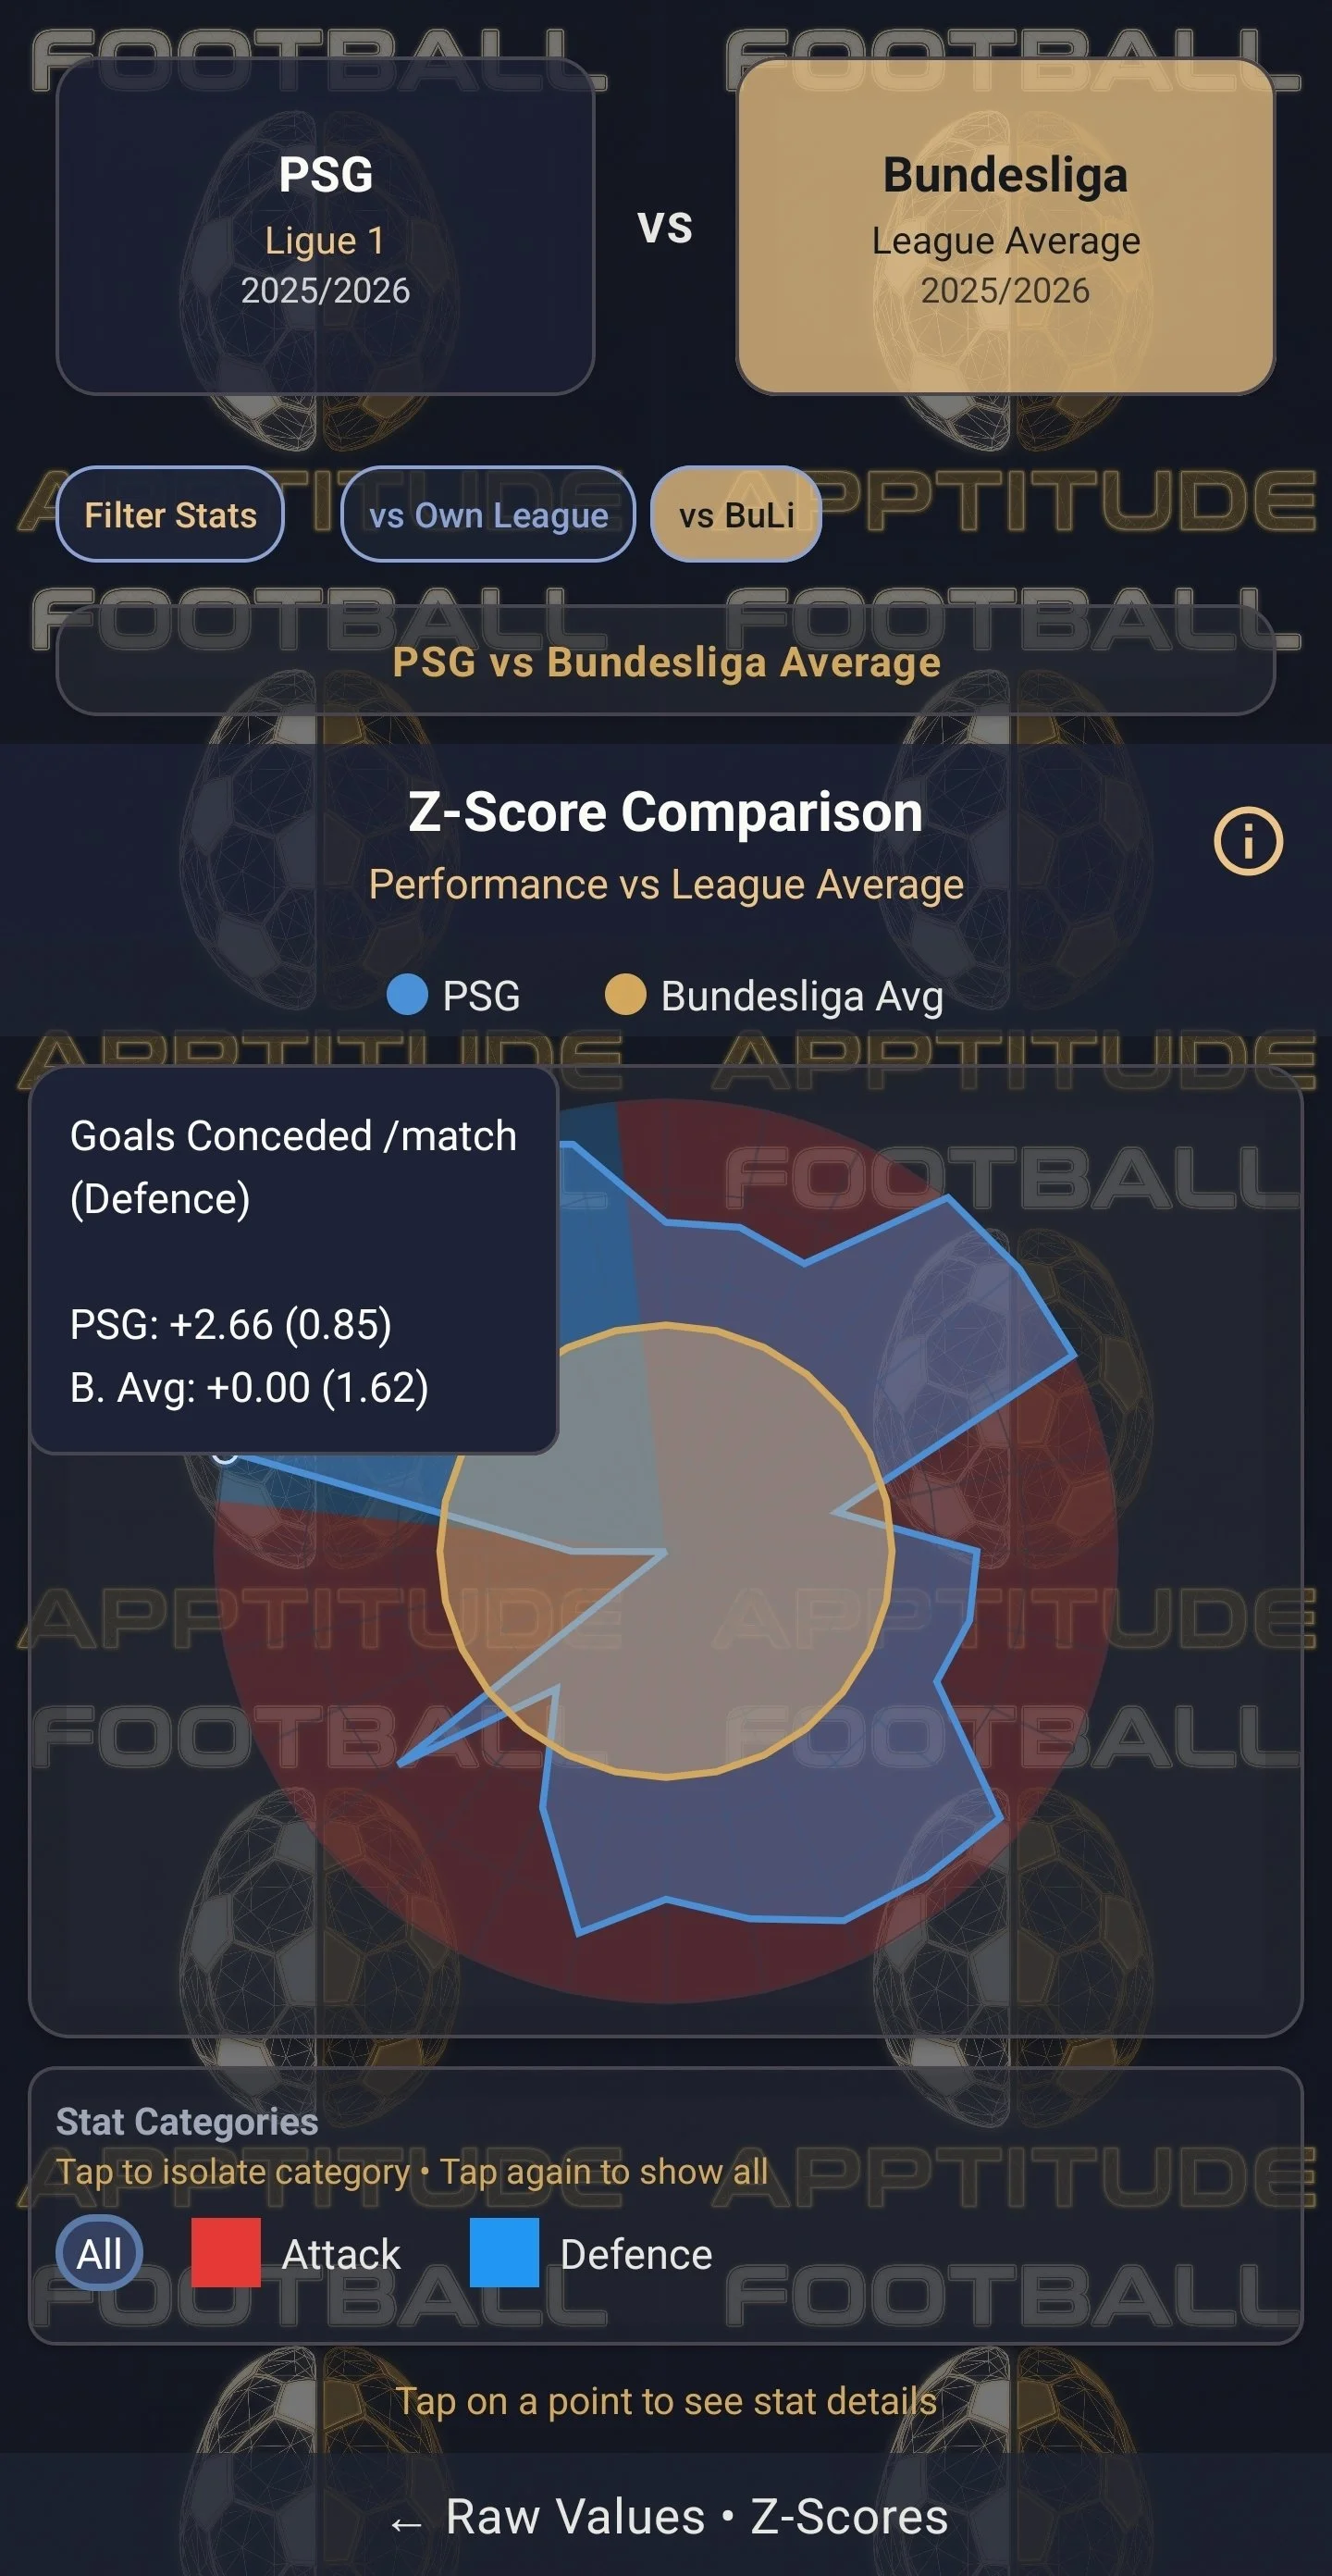
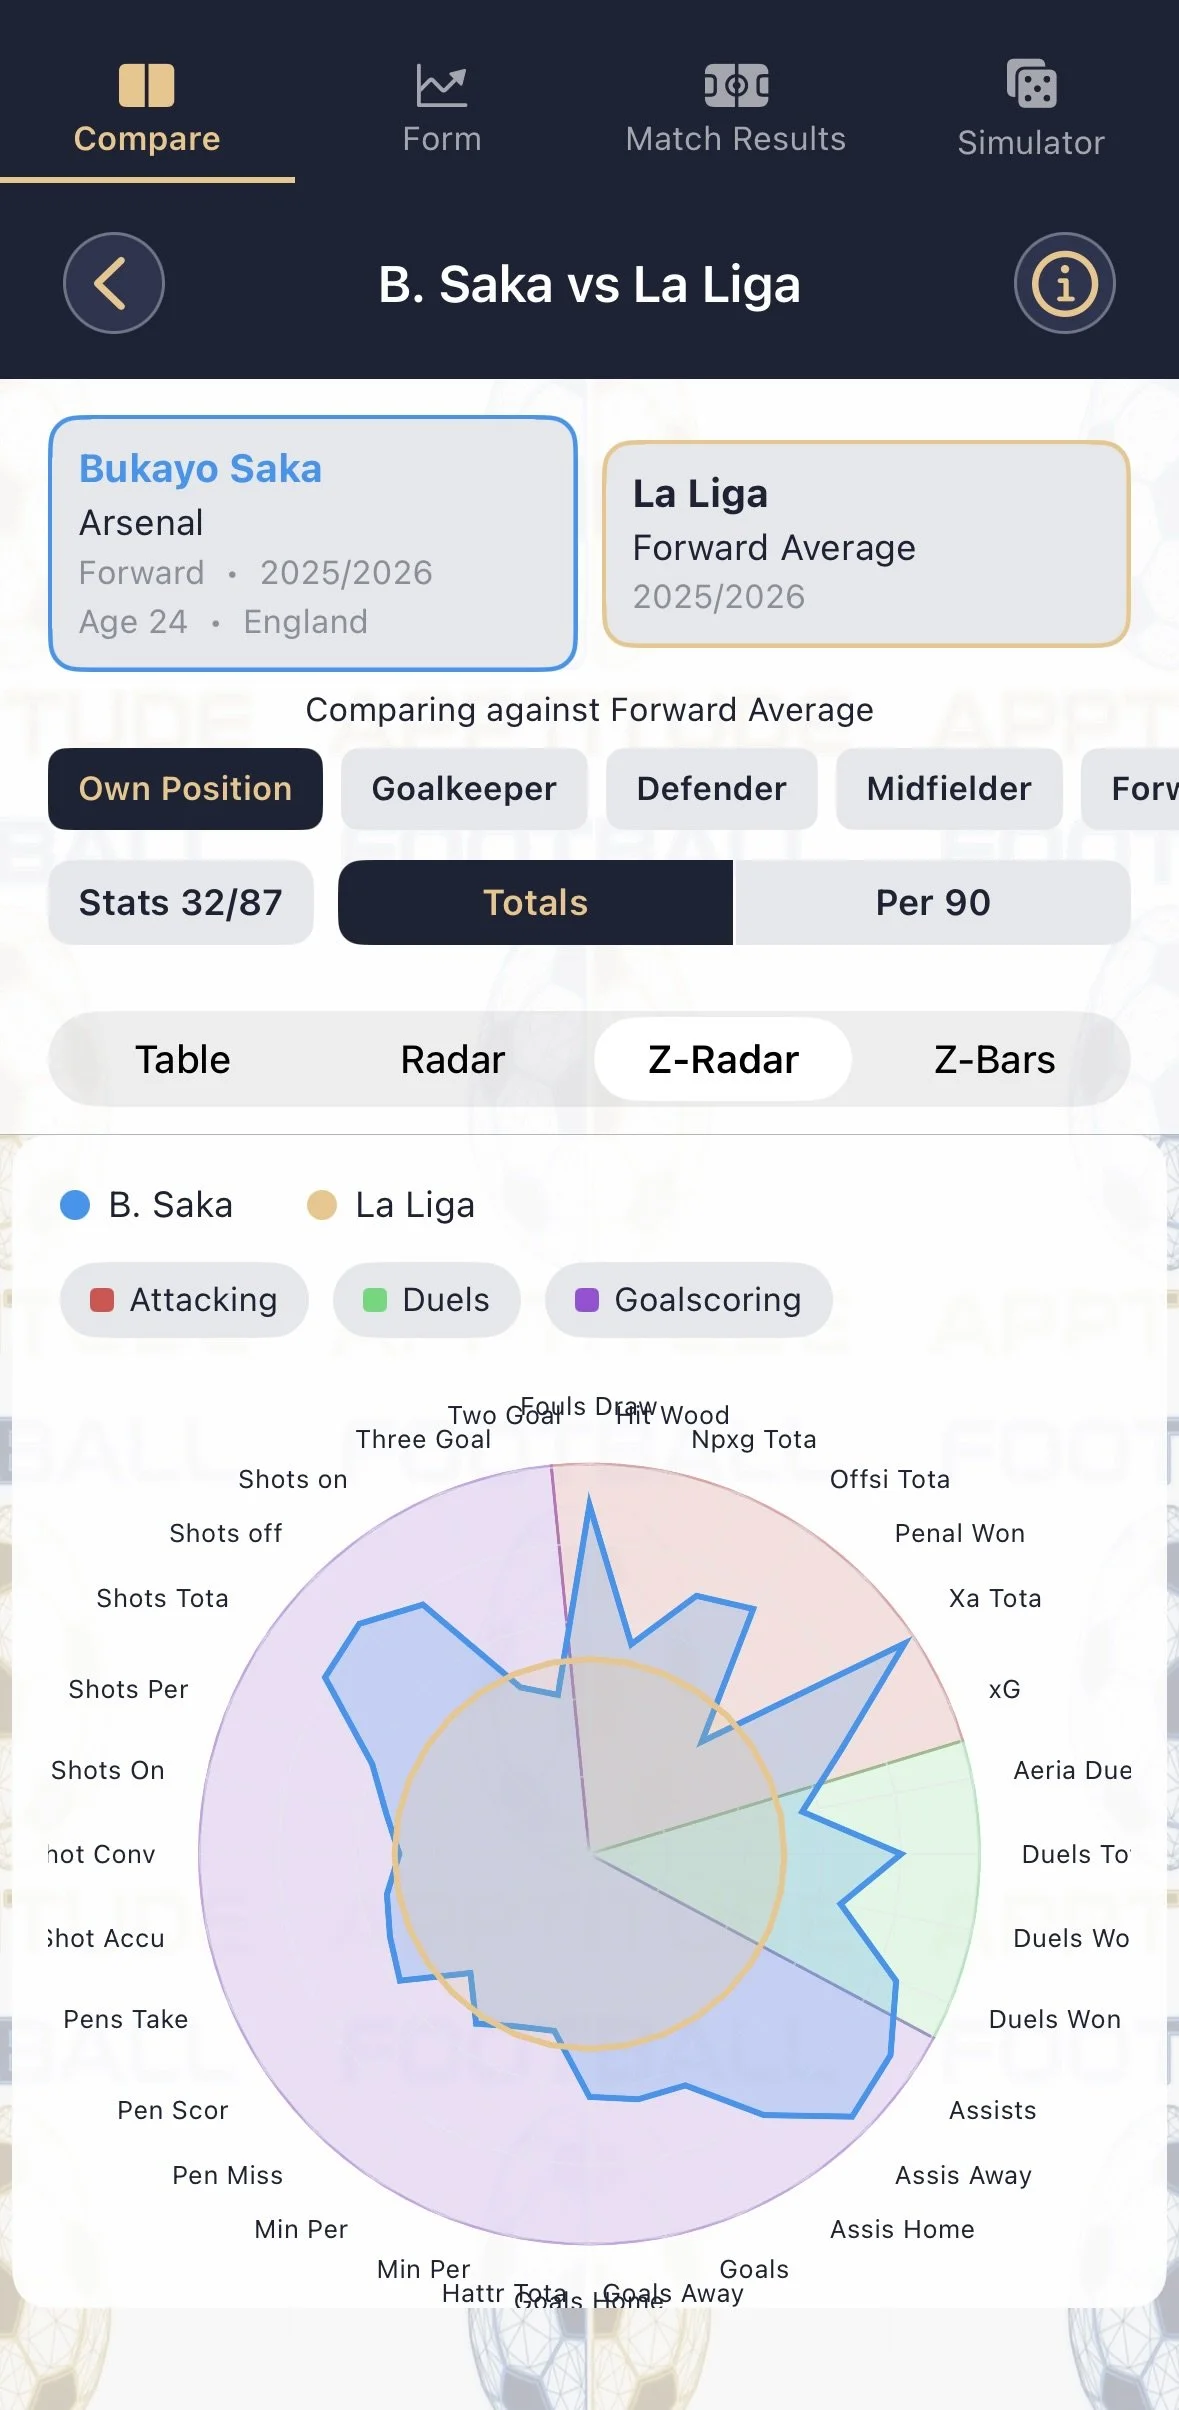
Two comparison types (Team vs Team, Team vs League), each with multiple filters and visualisation modes including z-score normalised comparisons.
-
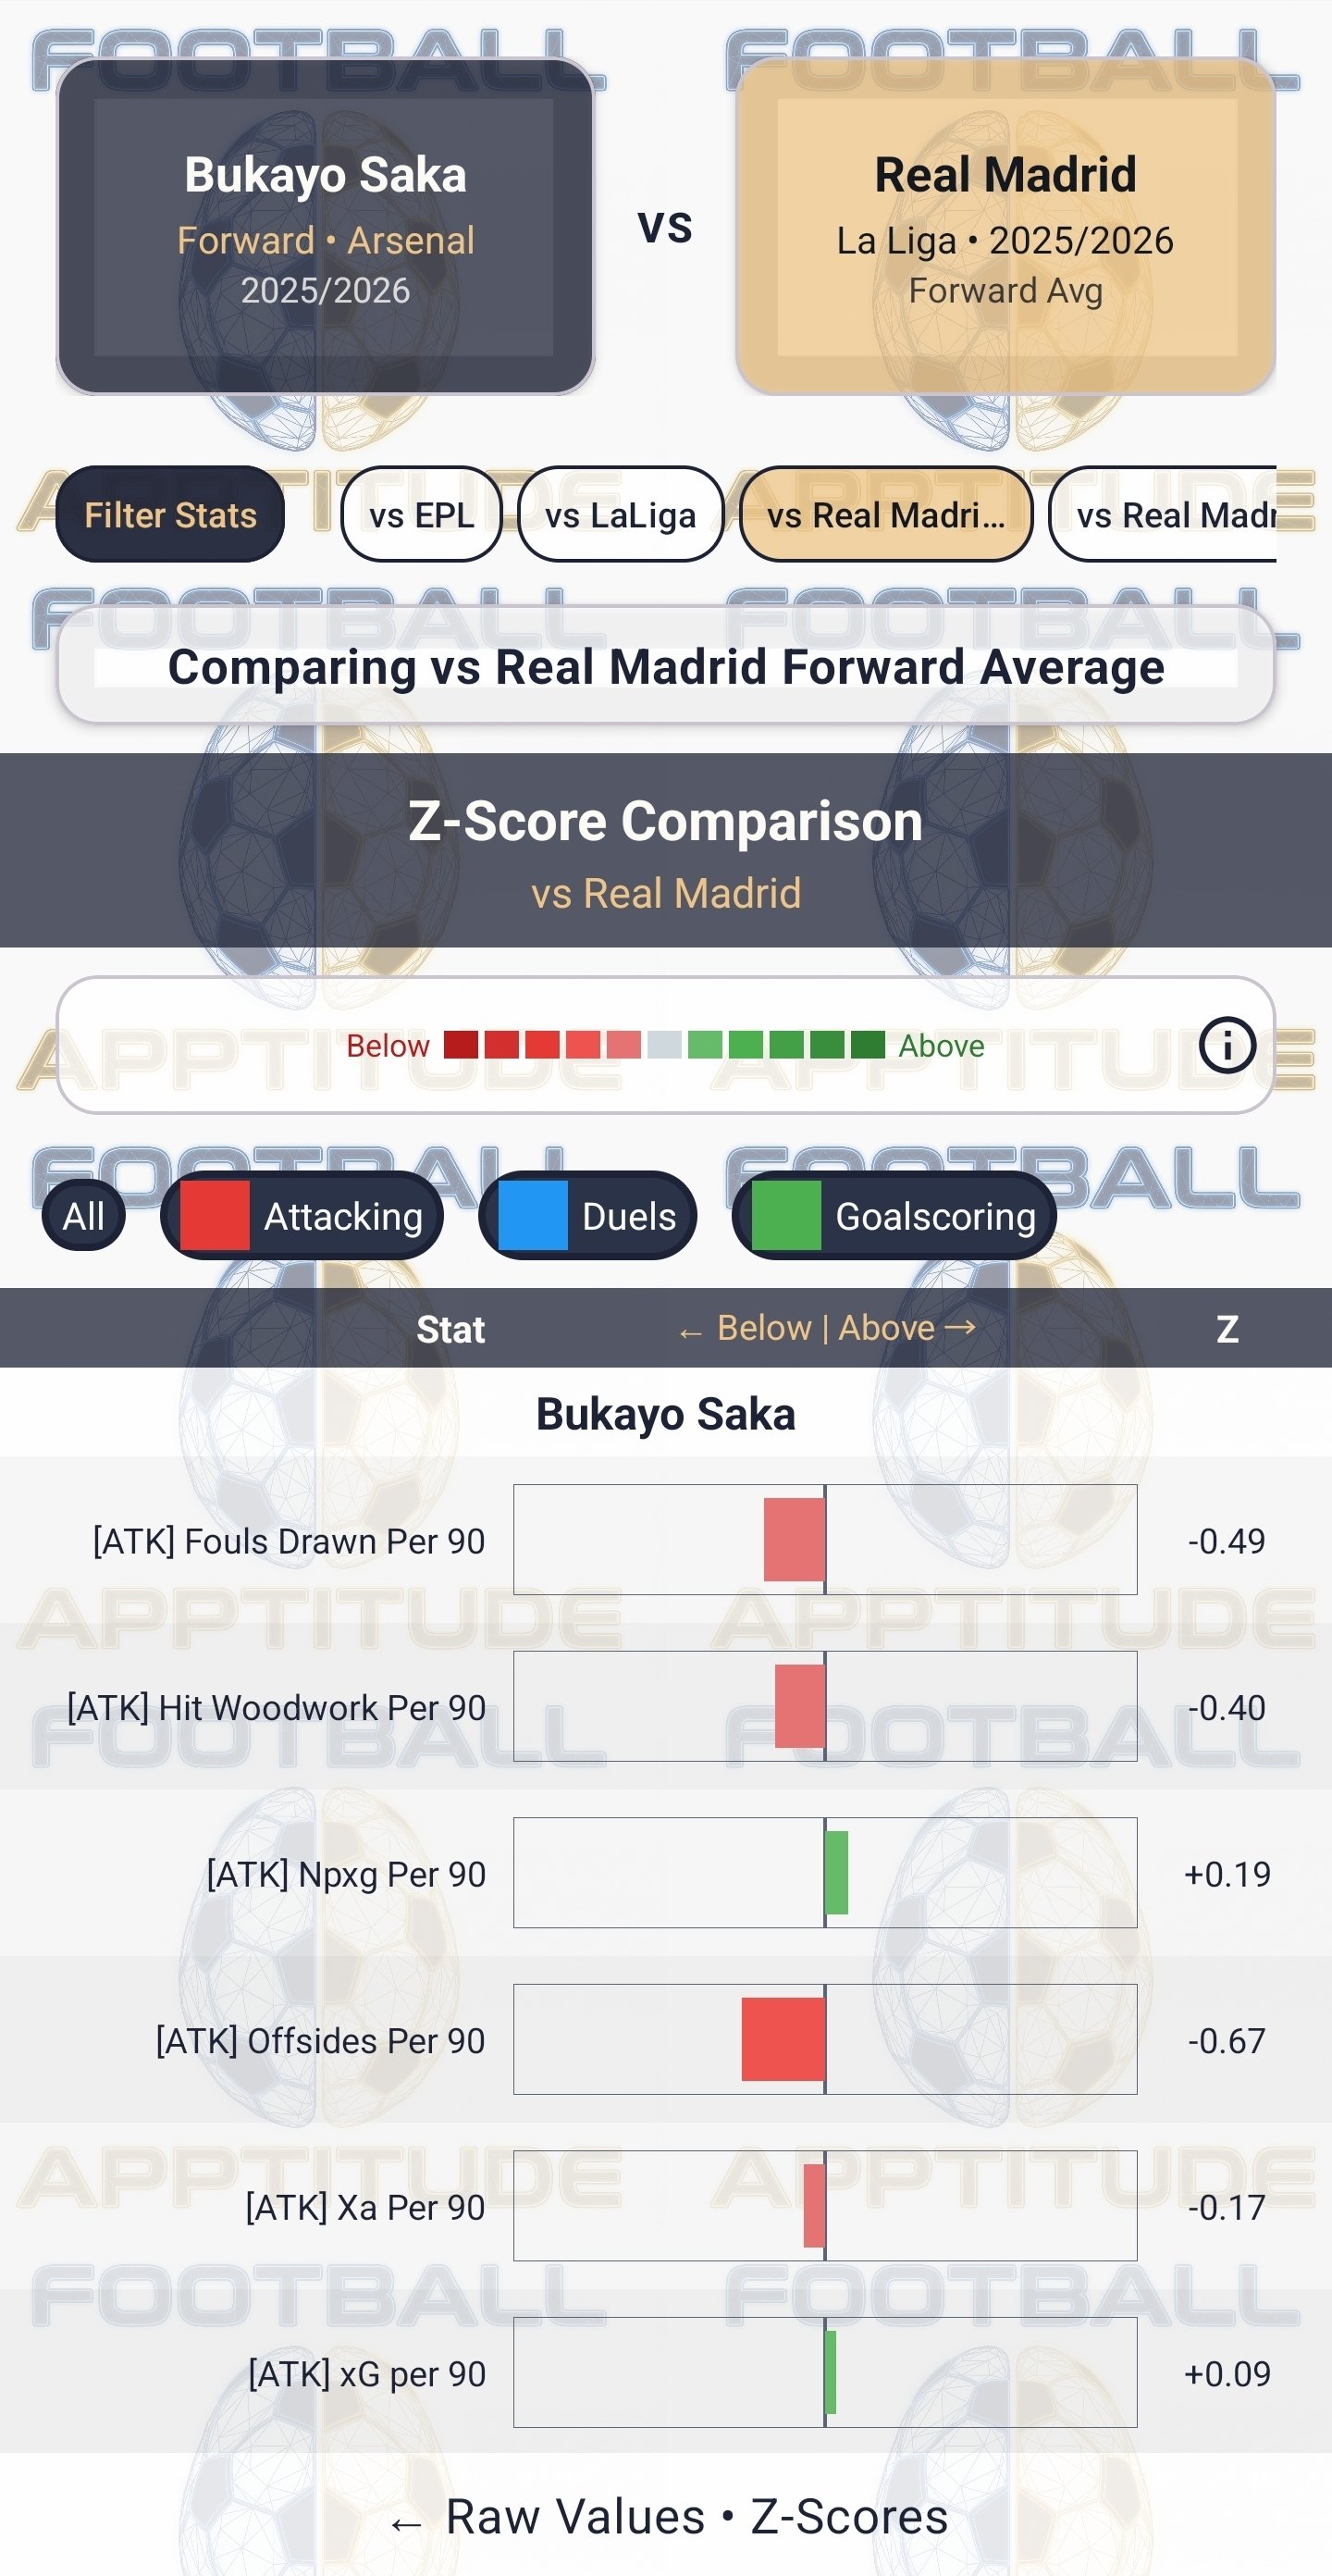
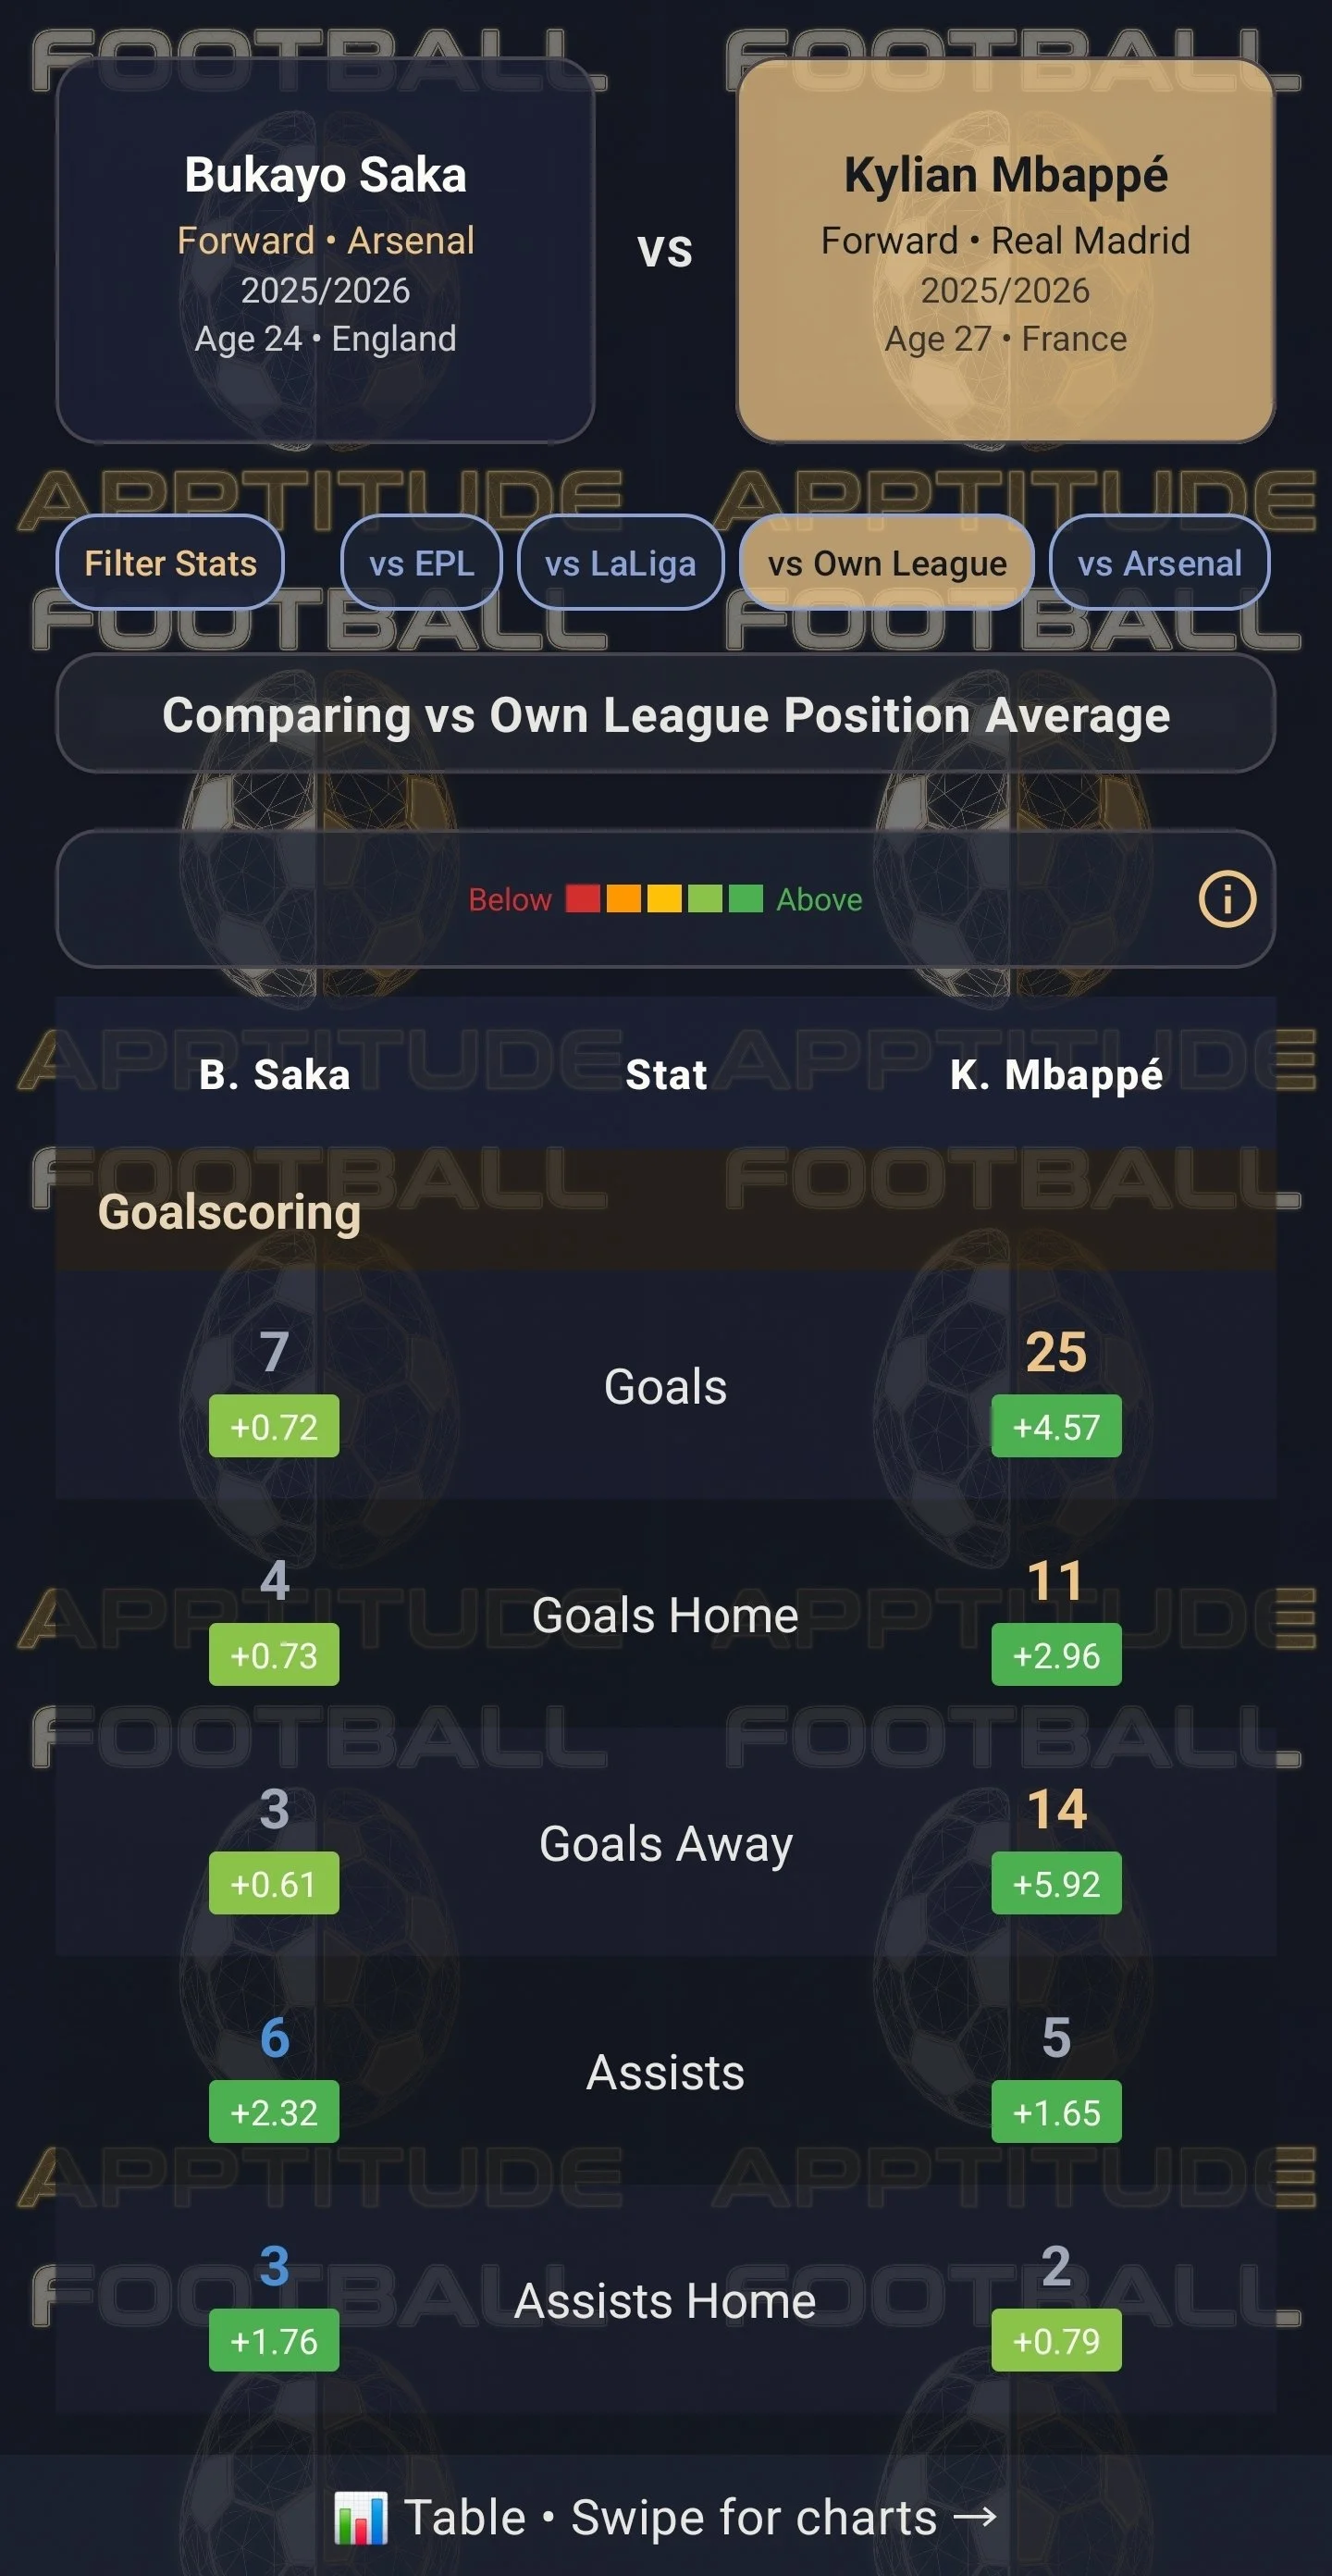
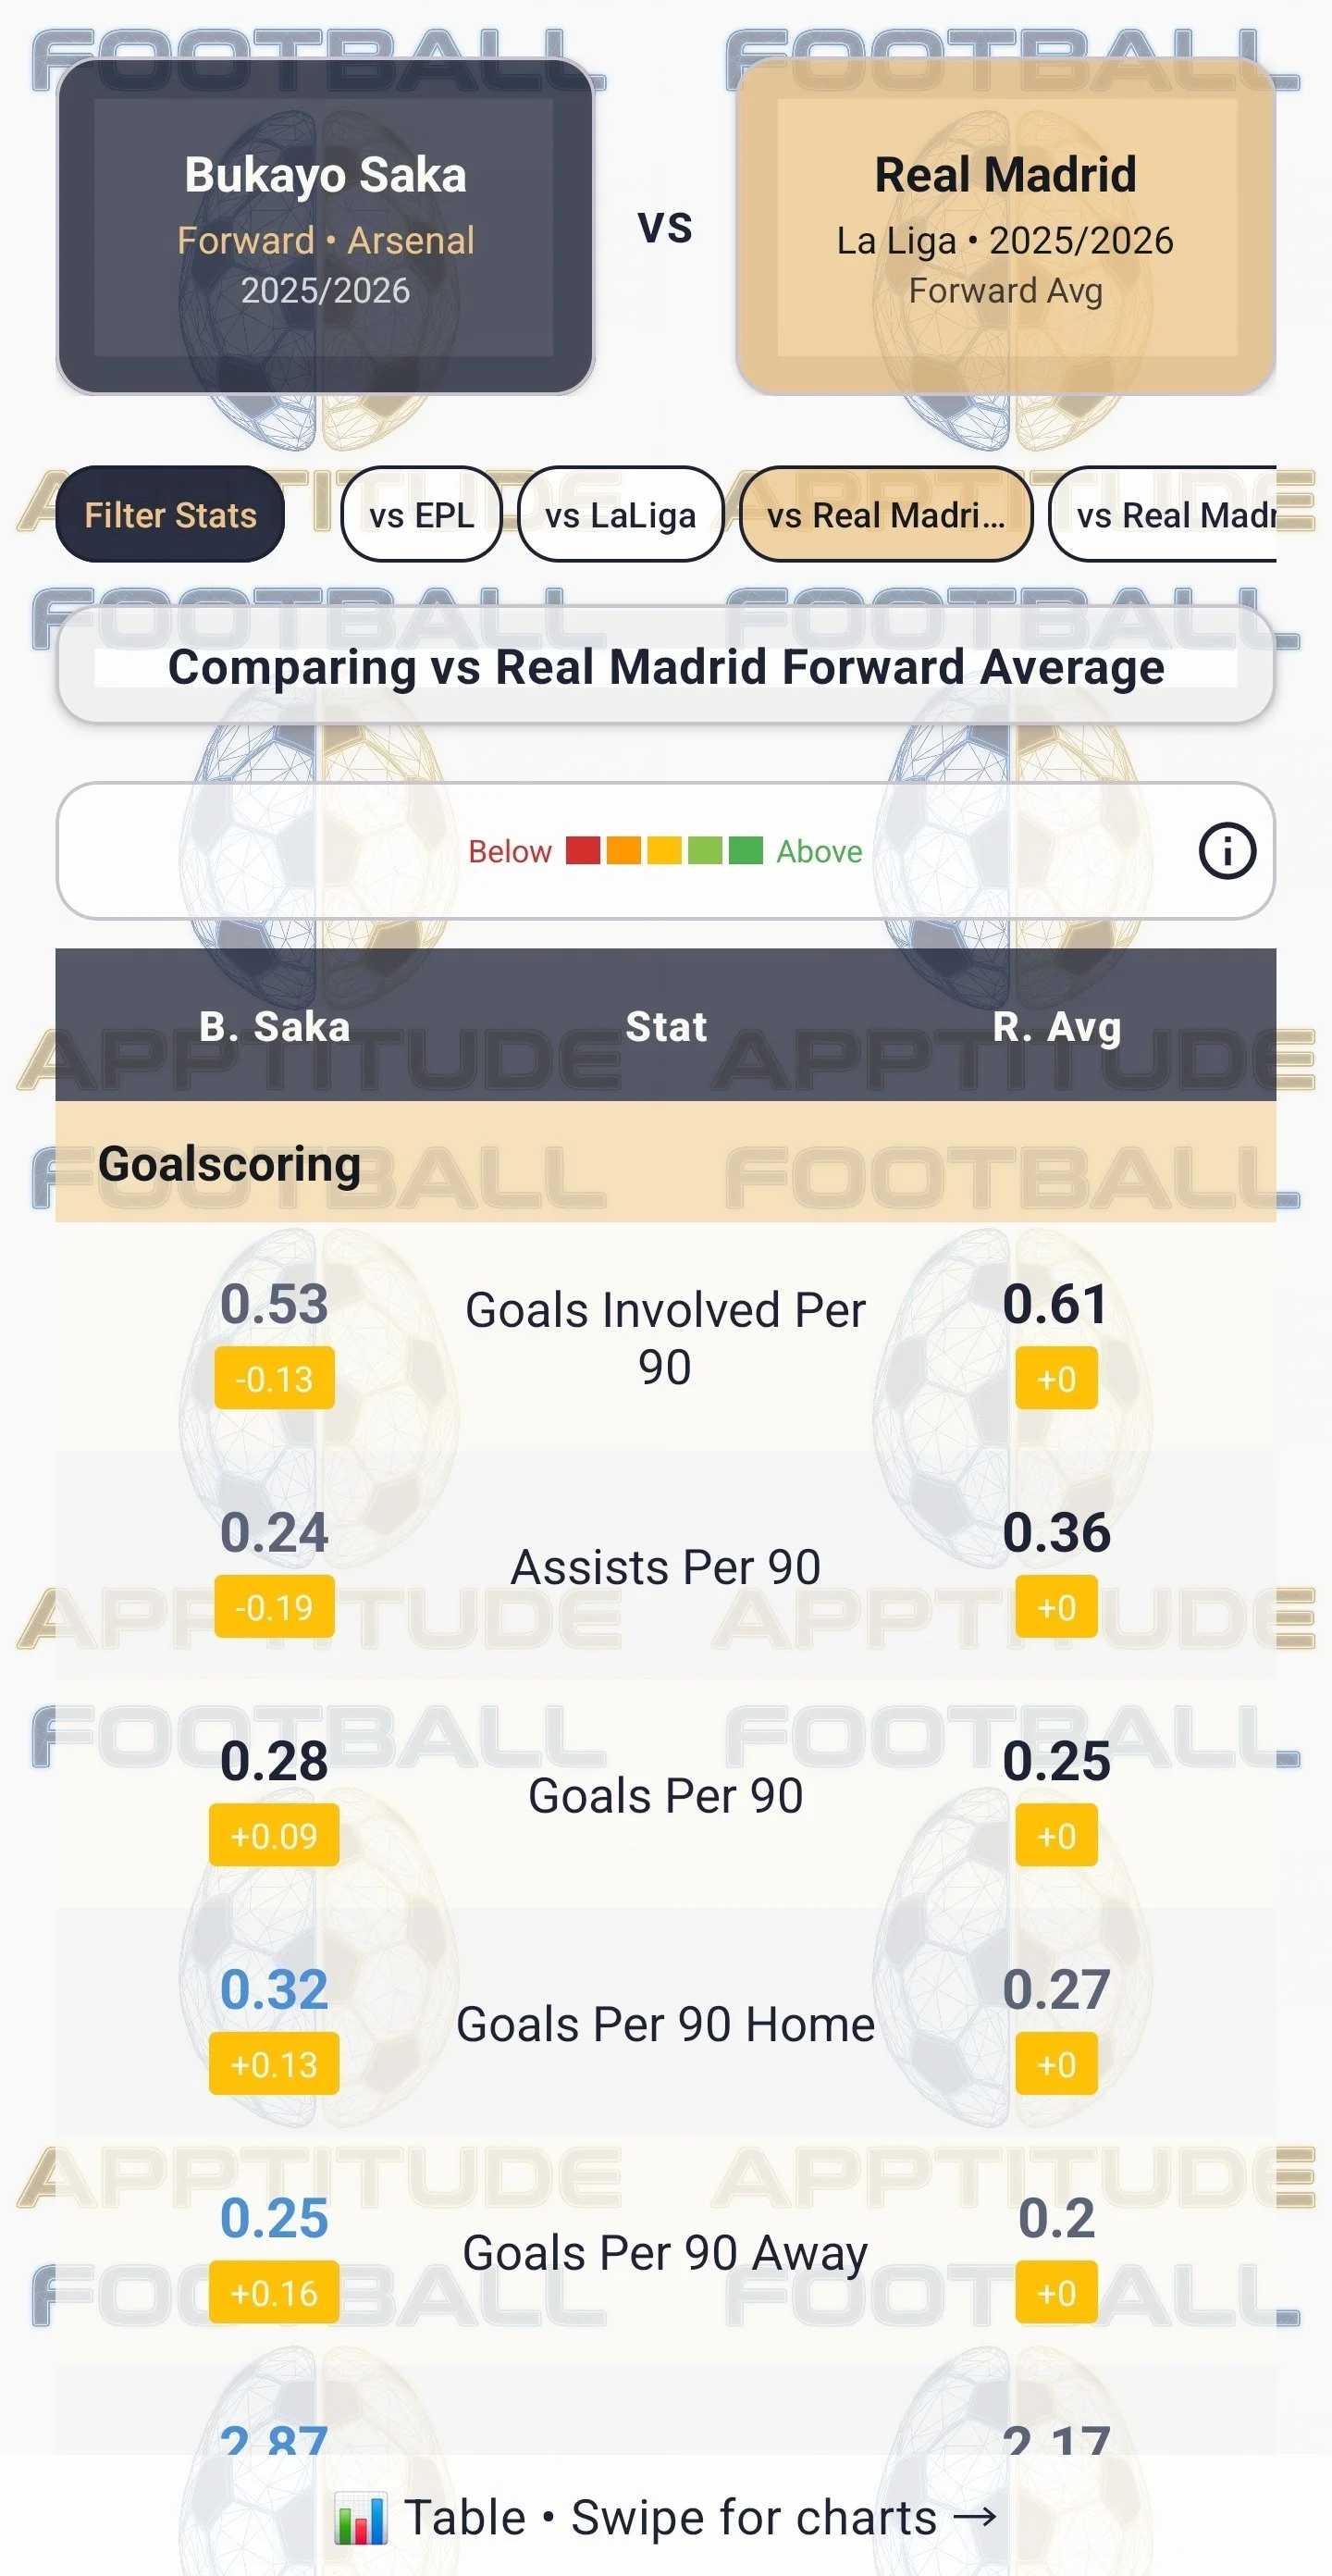
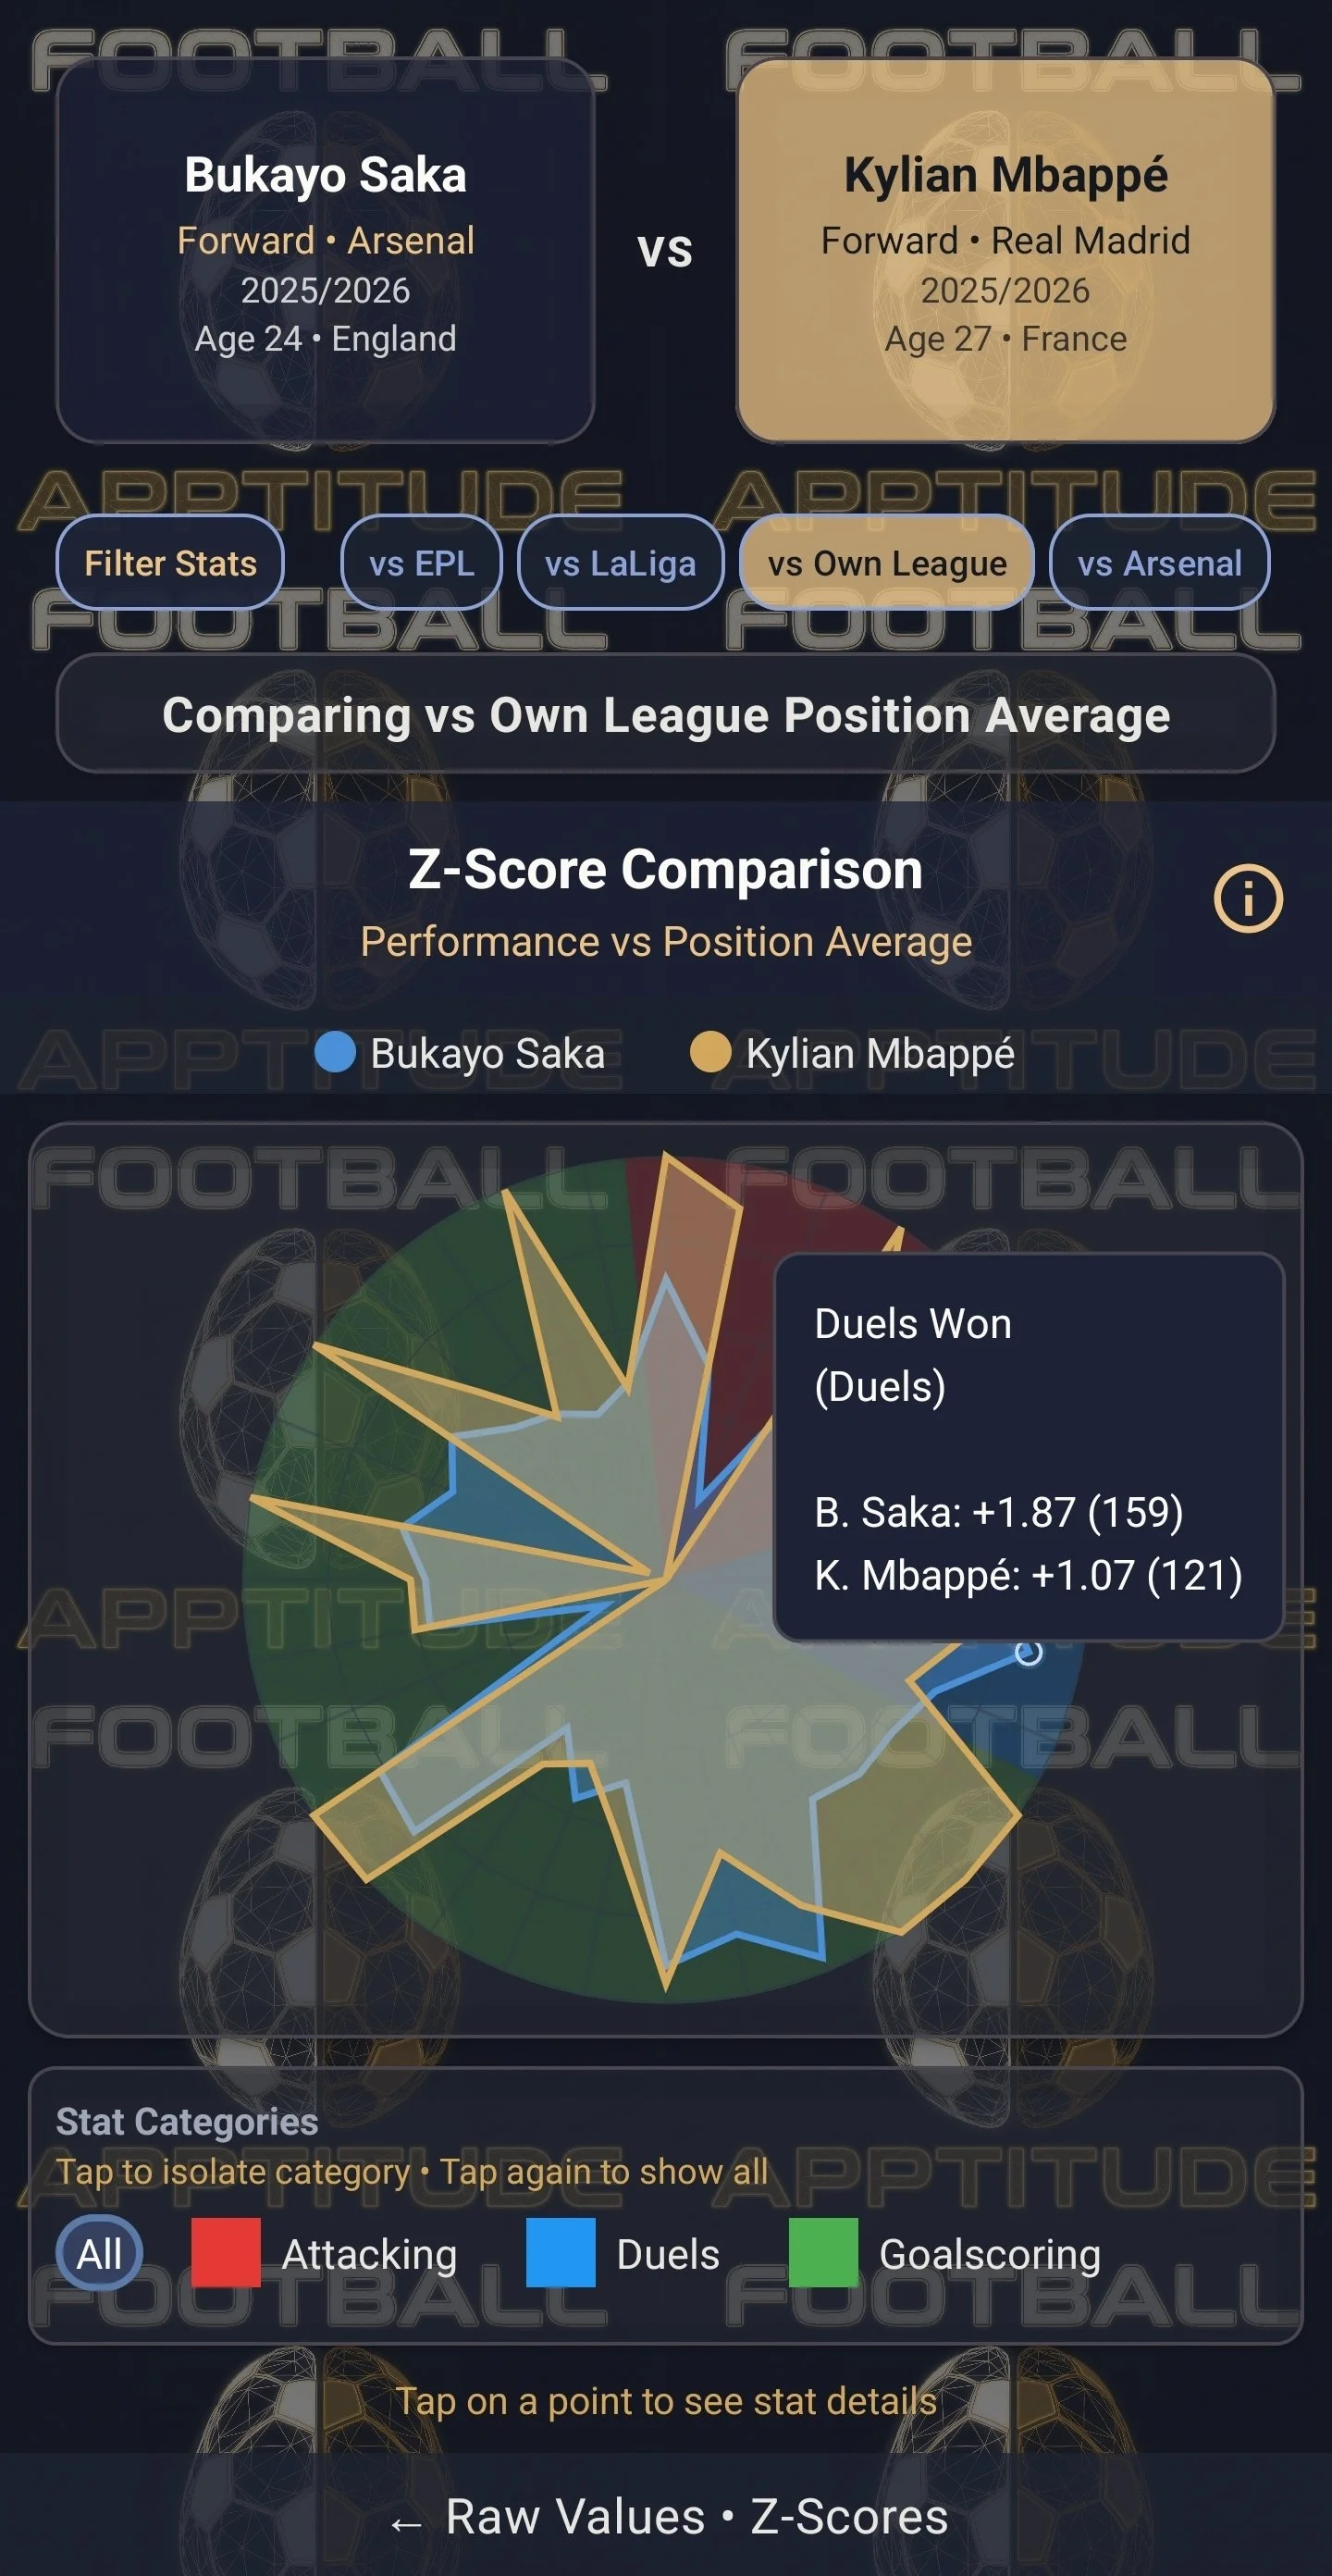
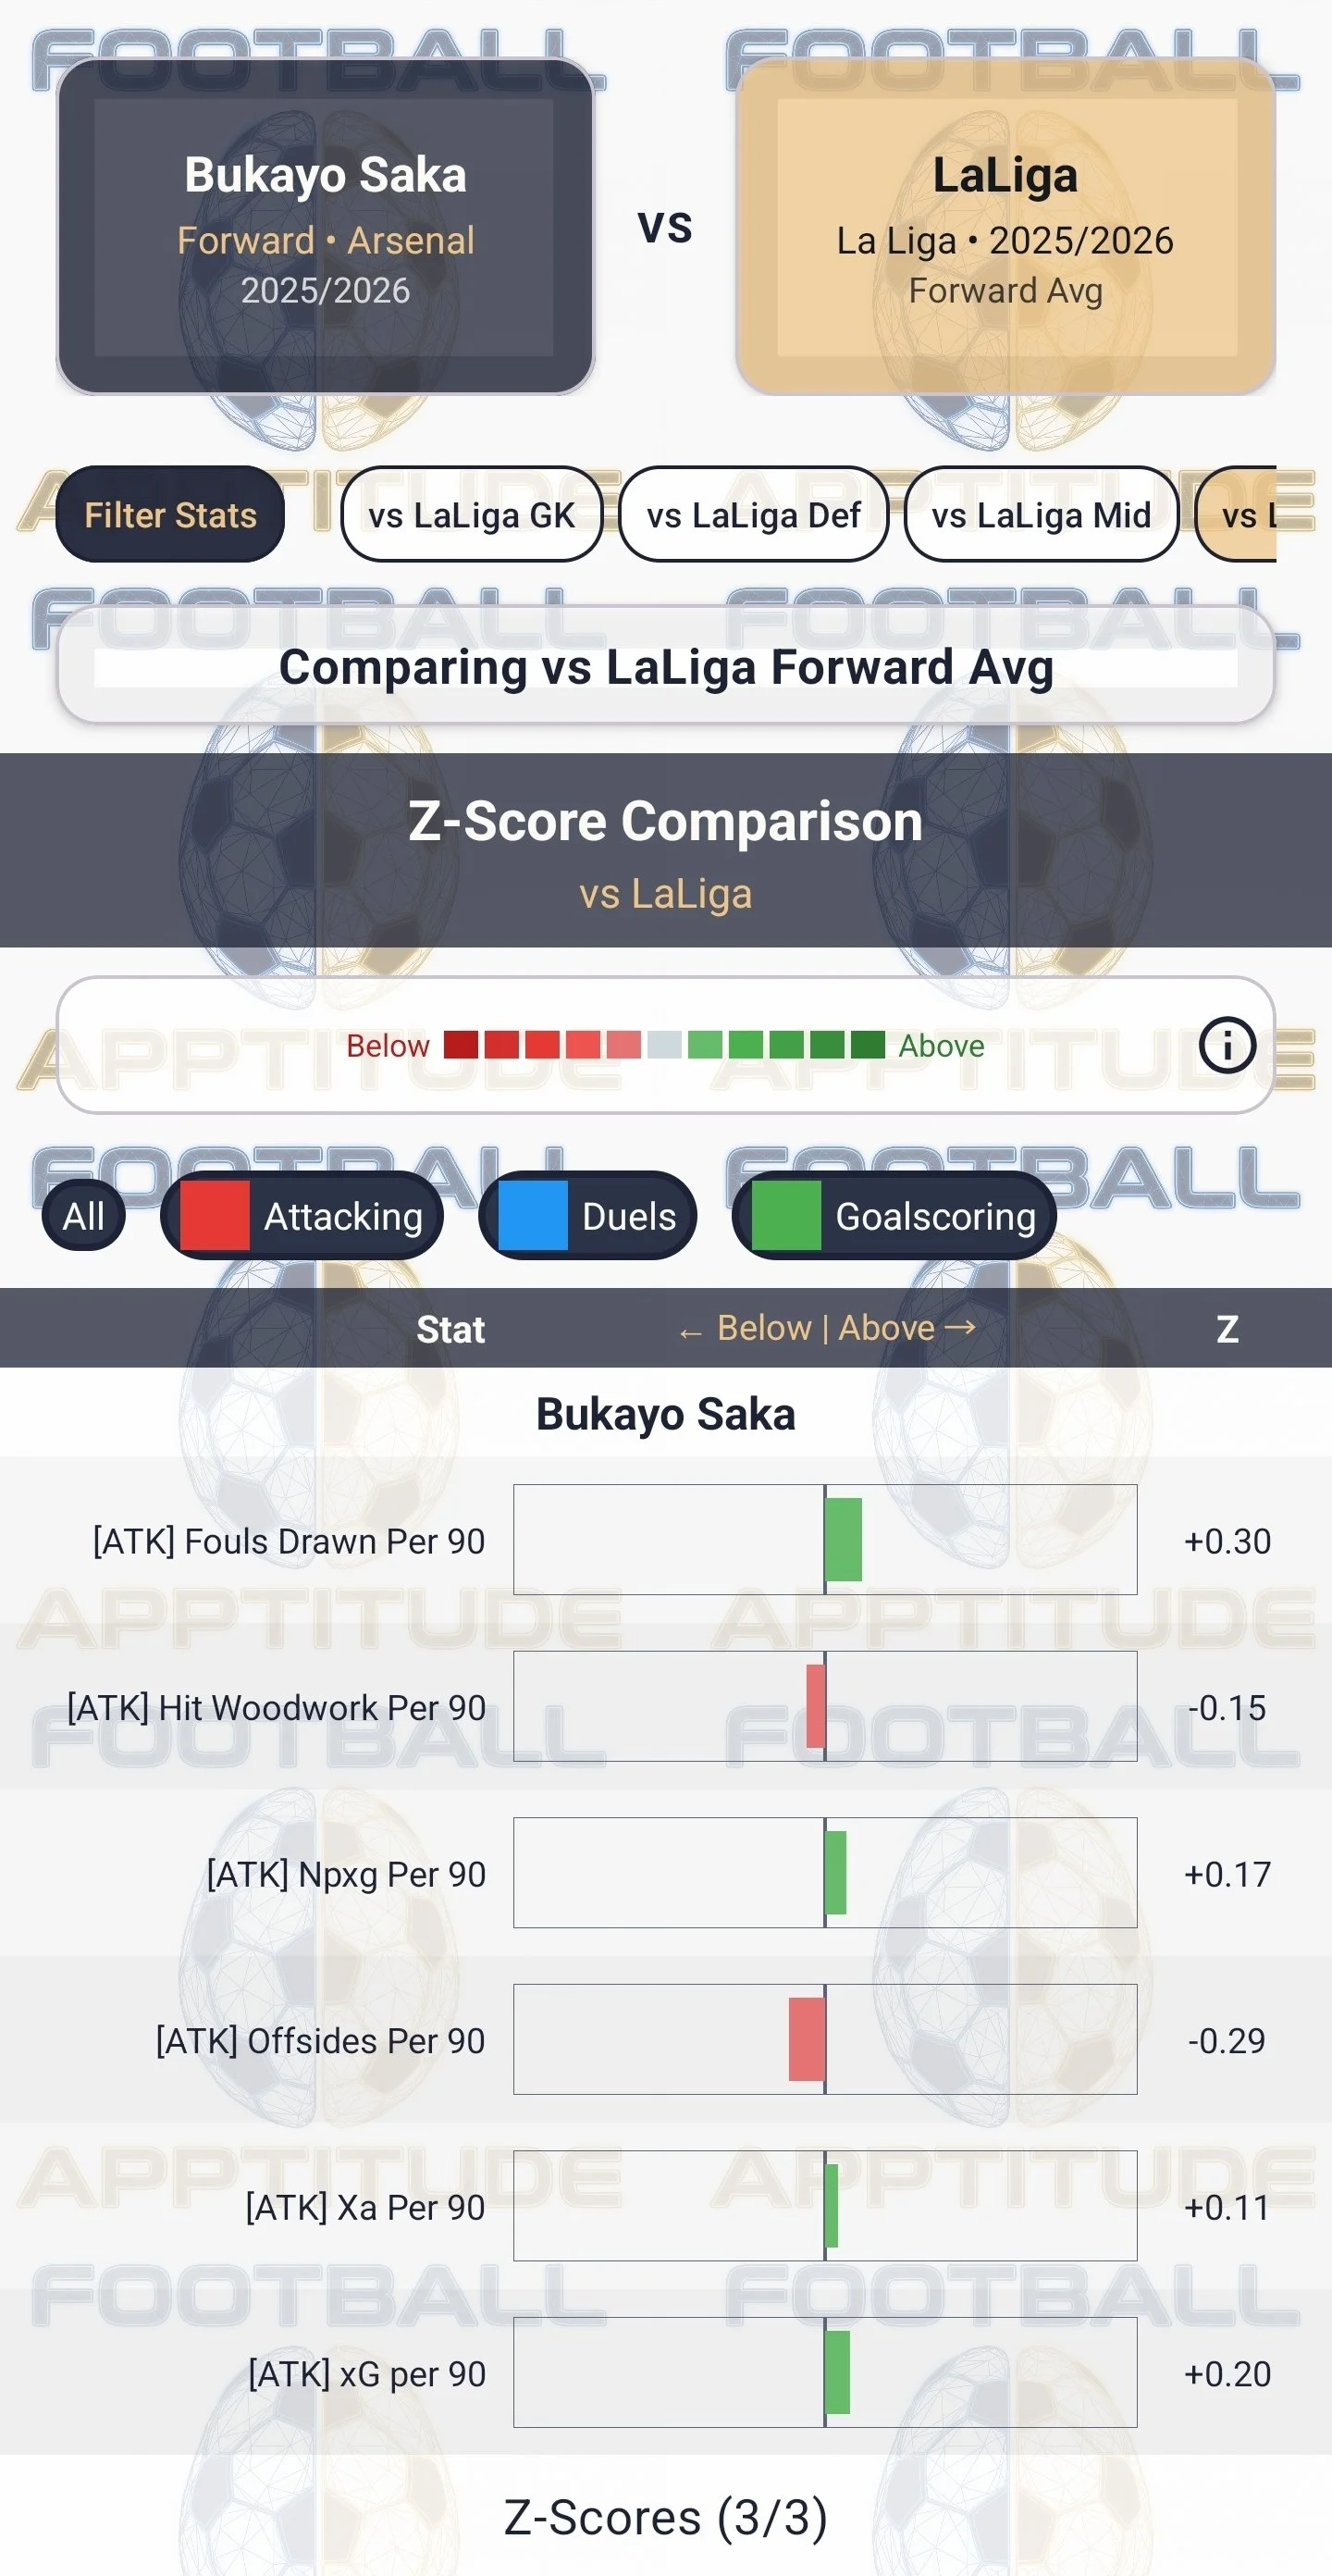
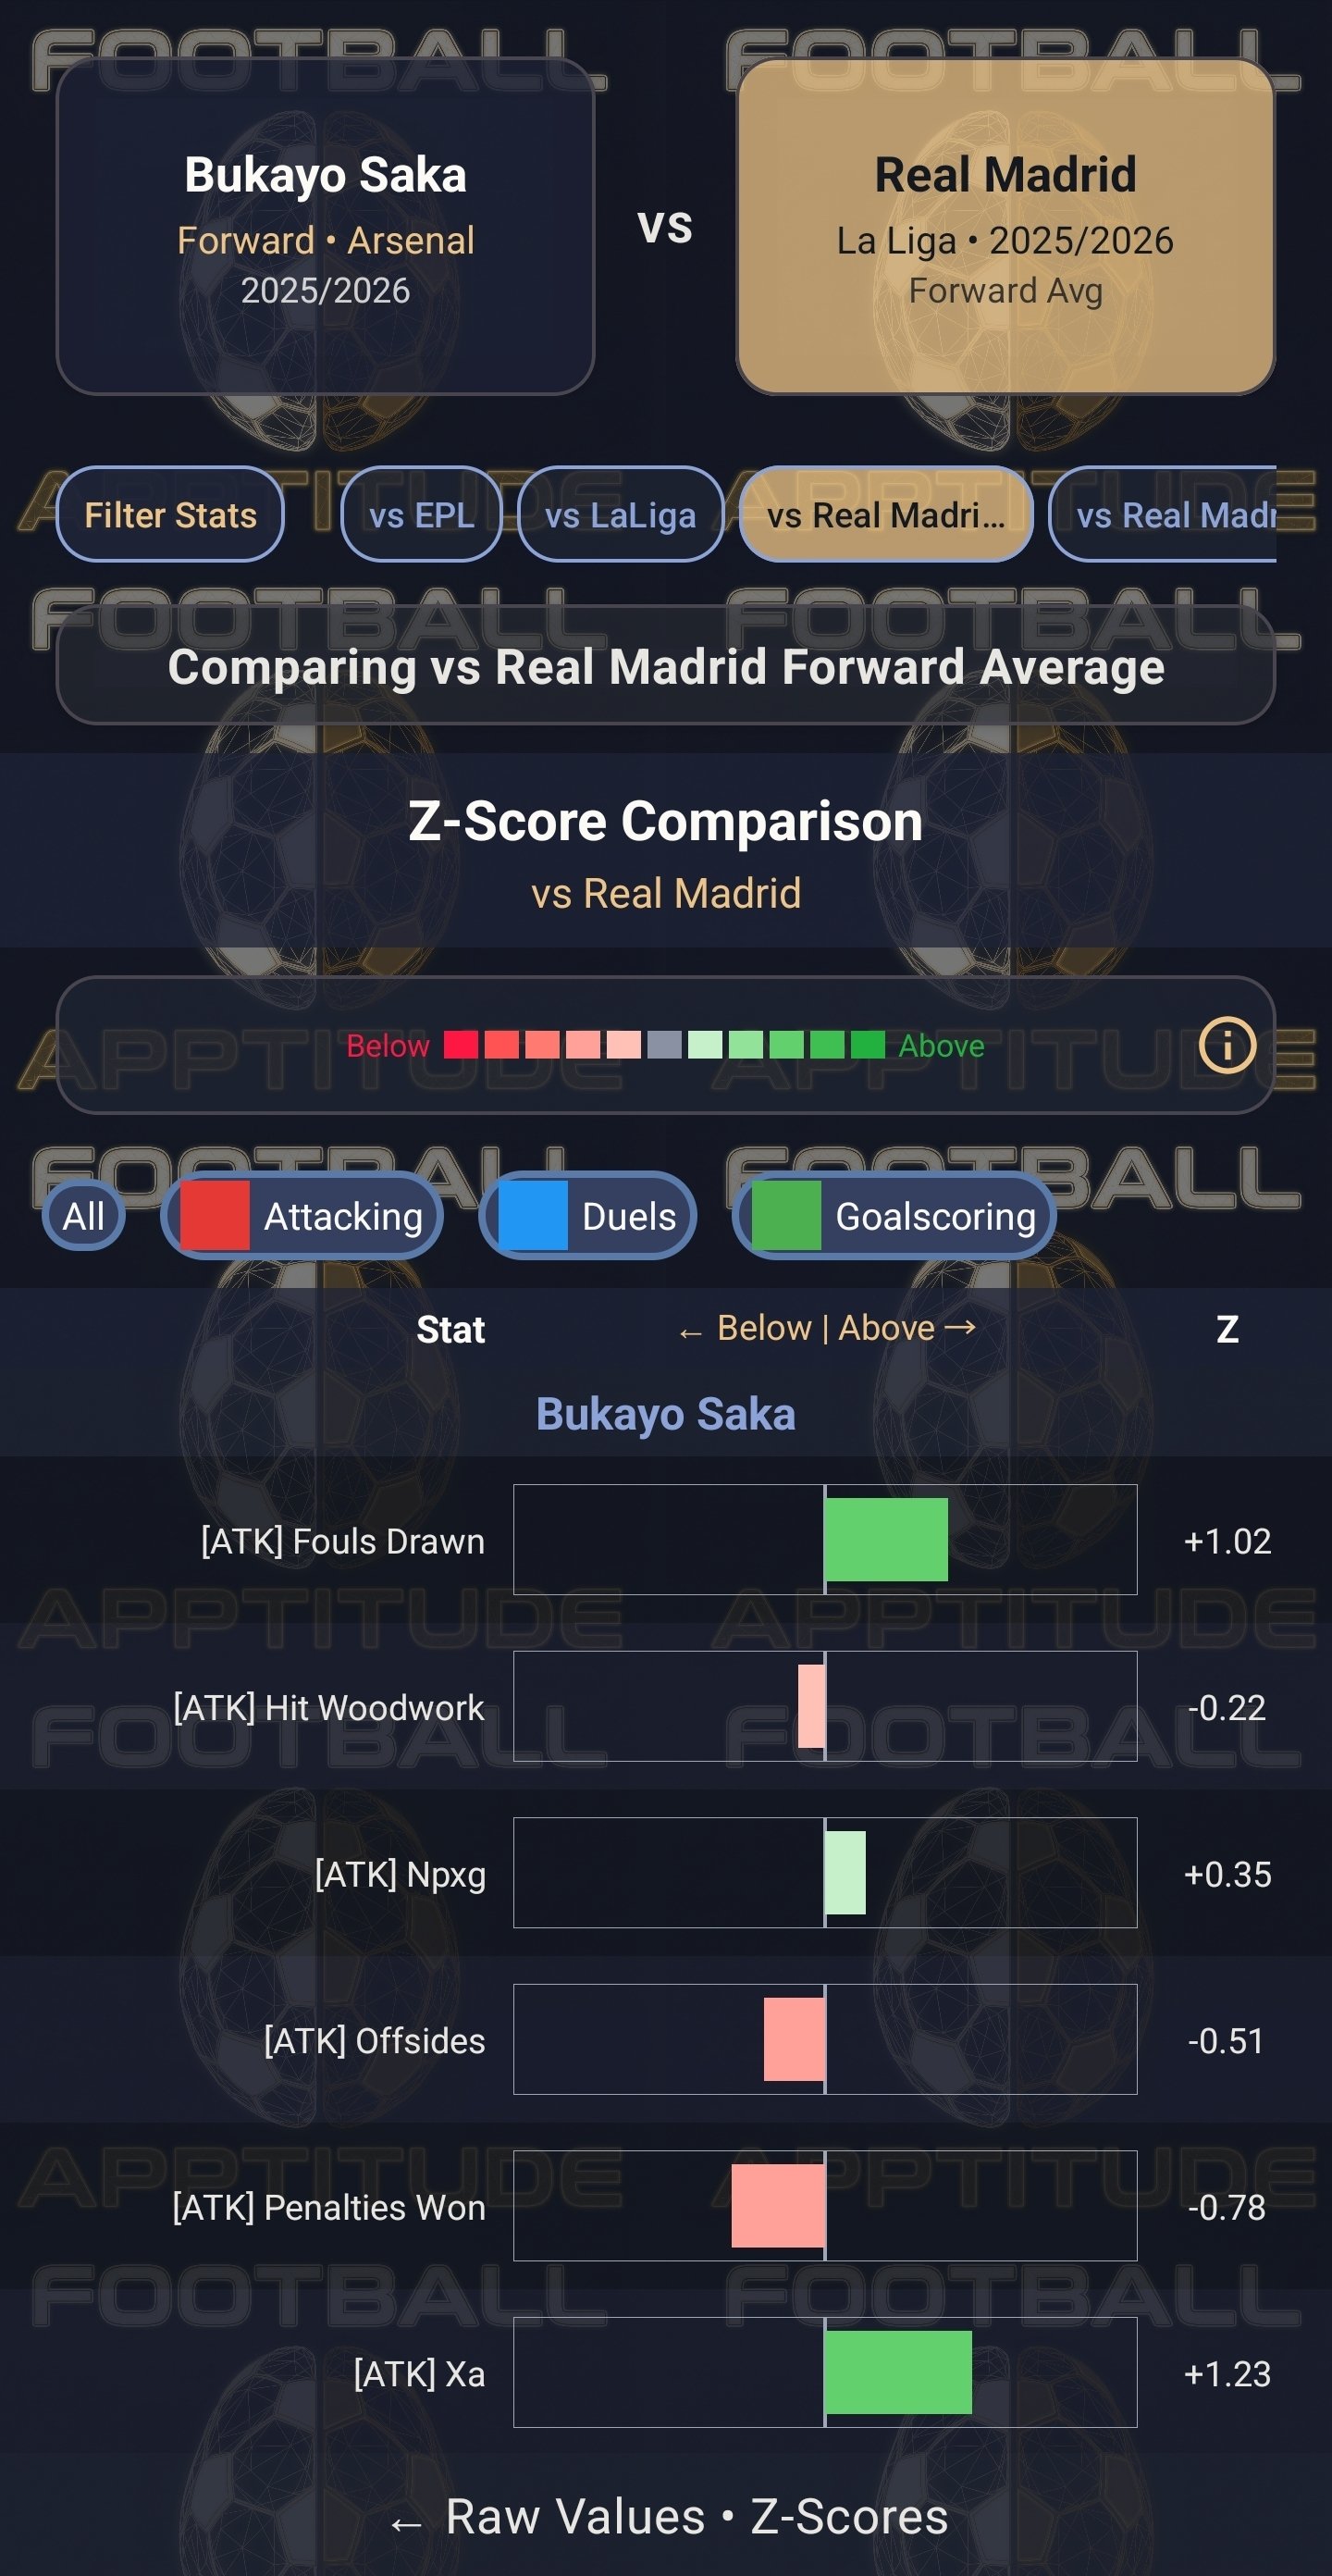
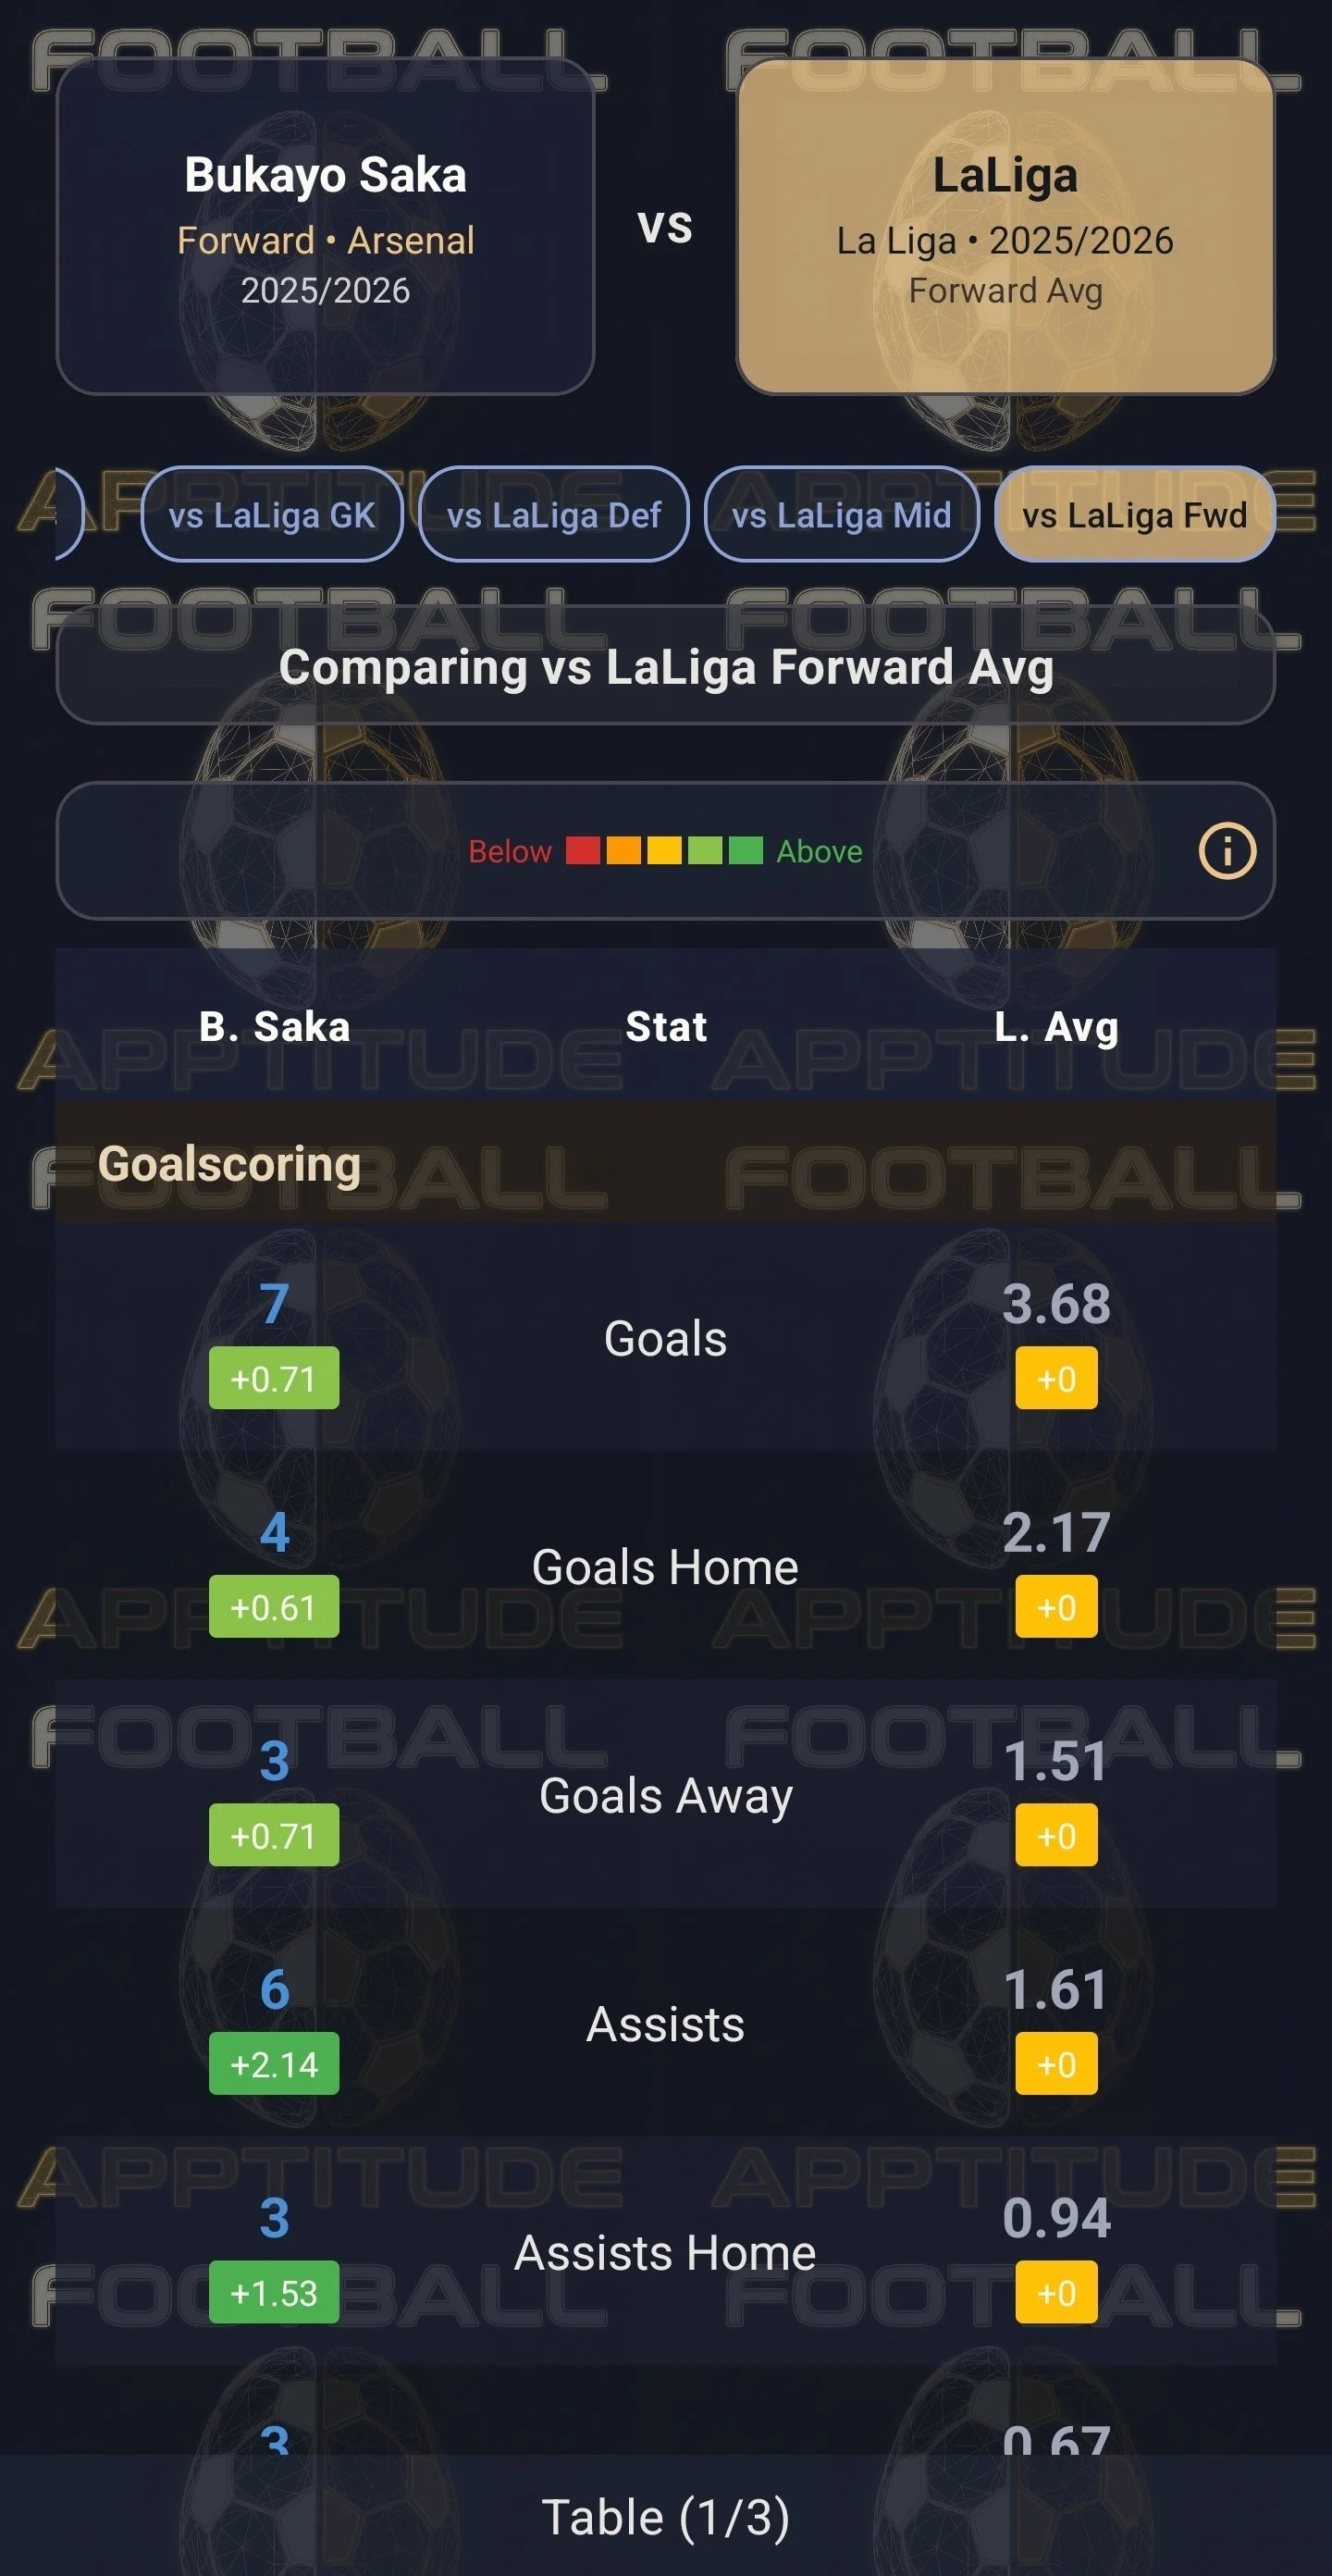
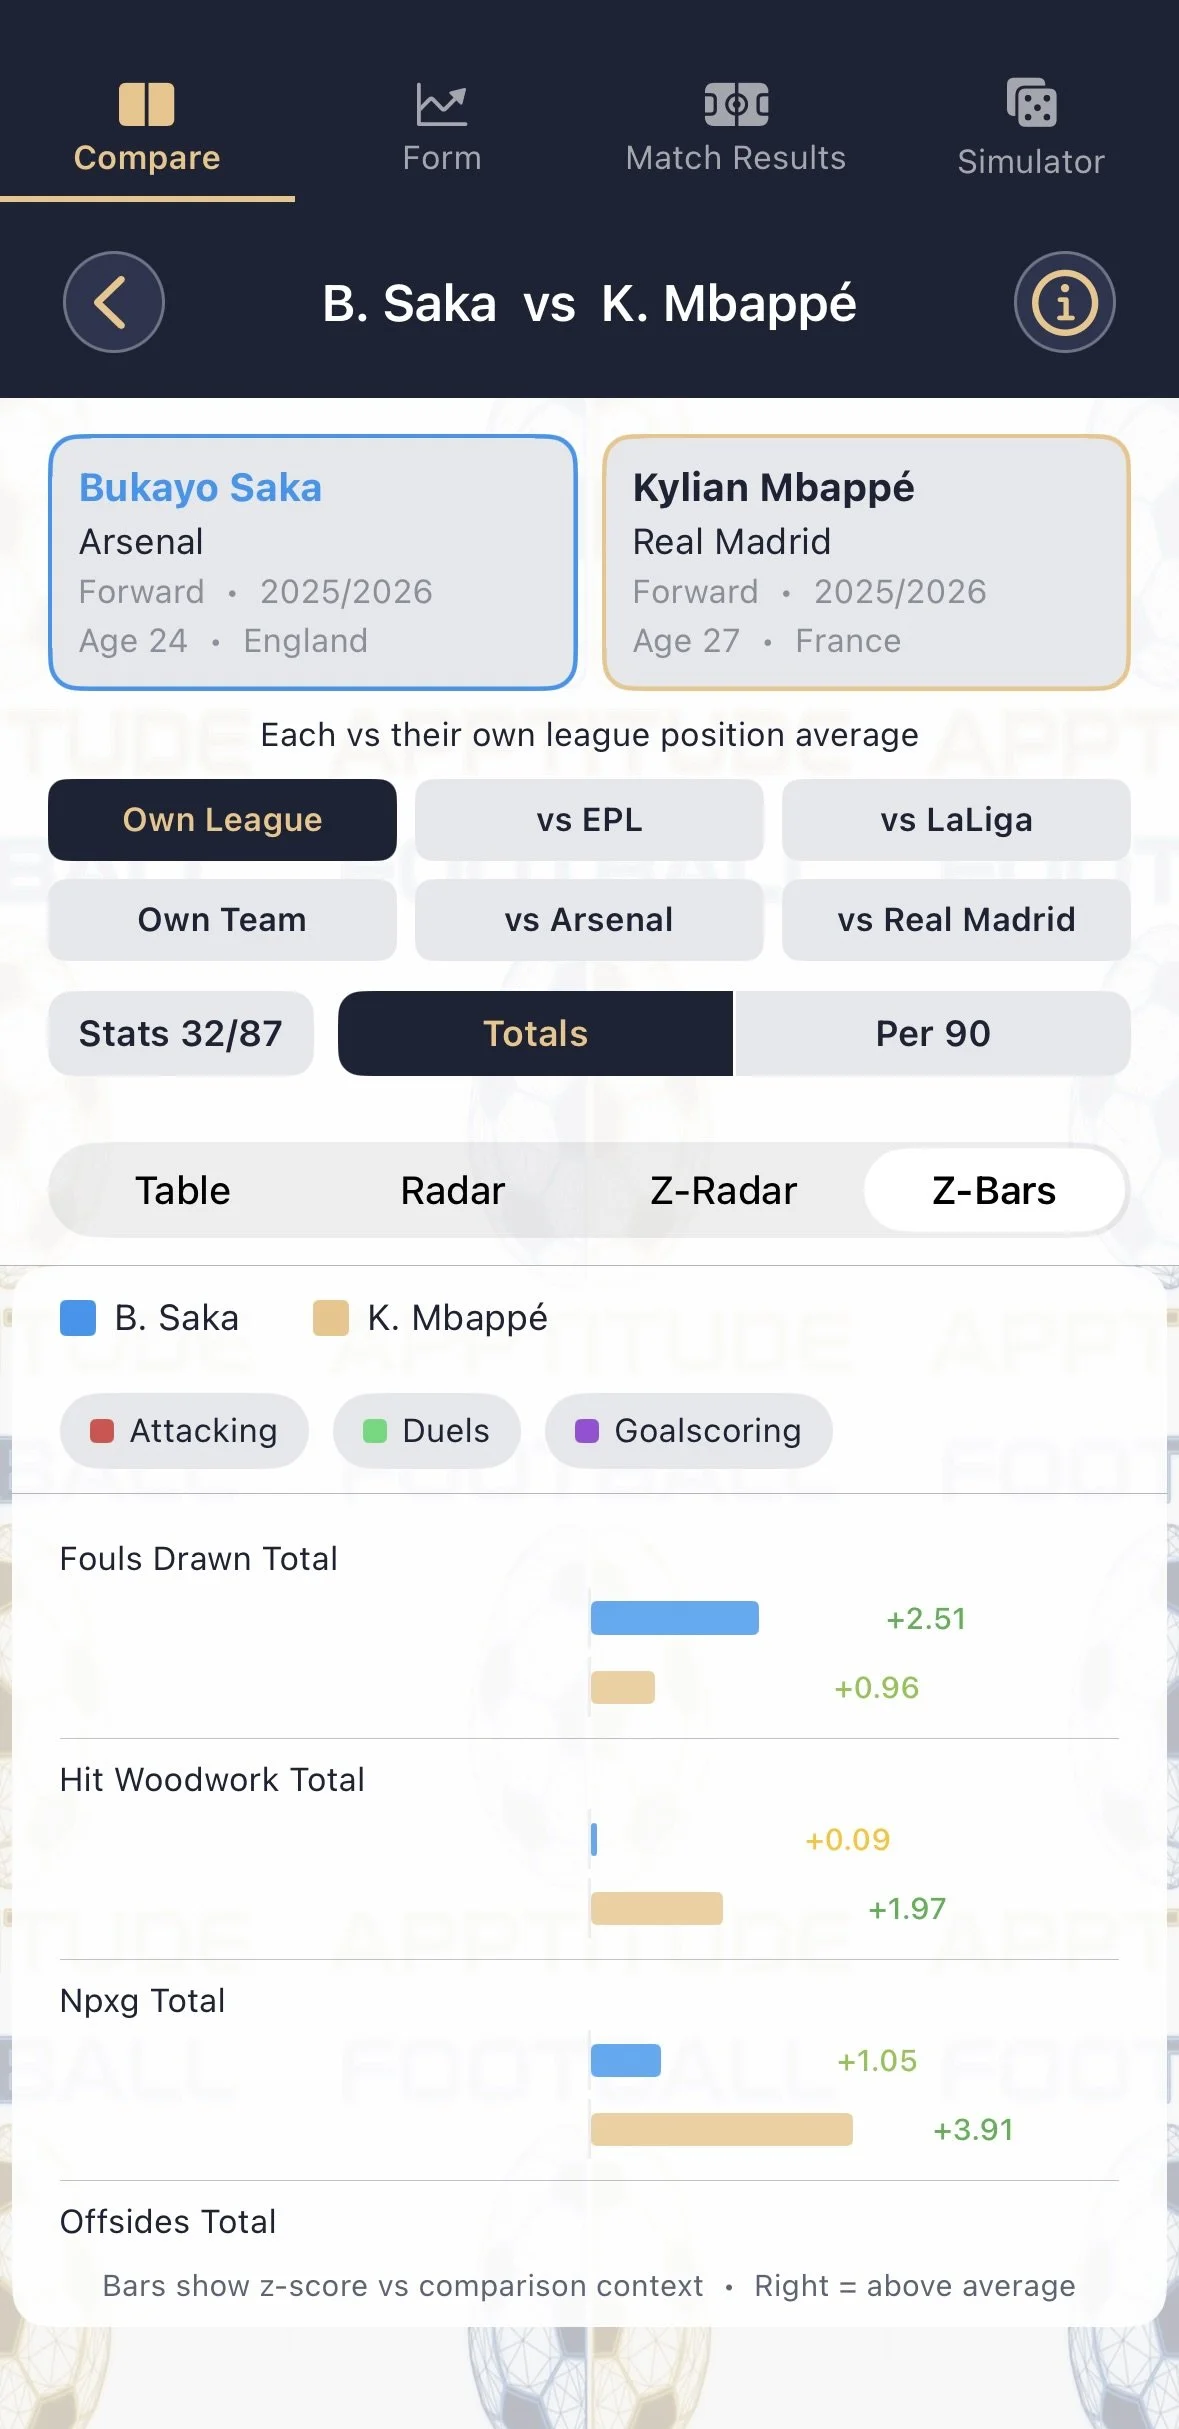
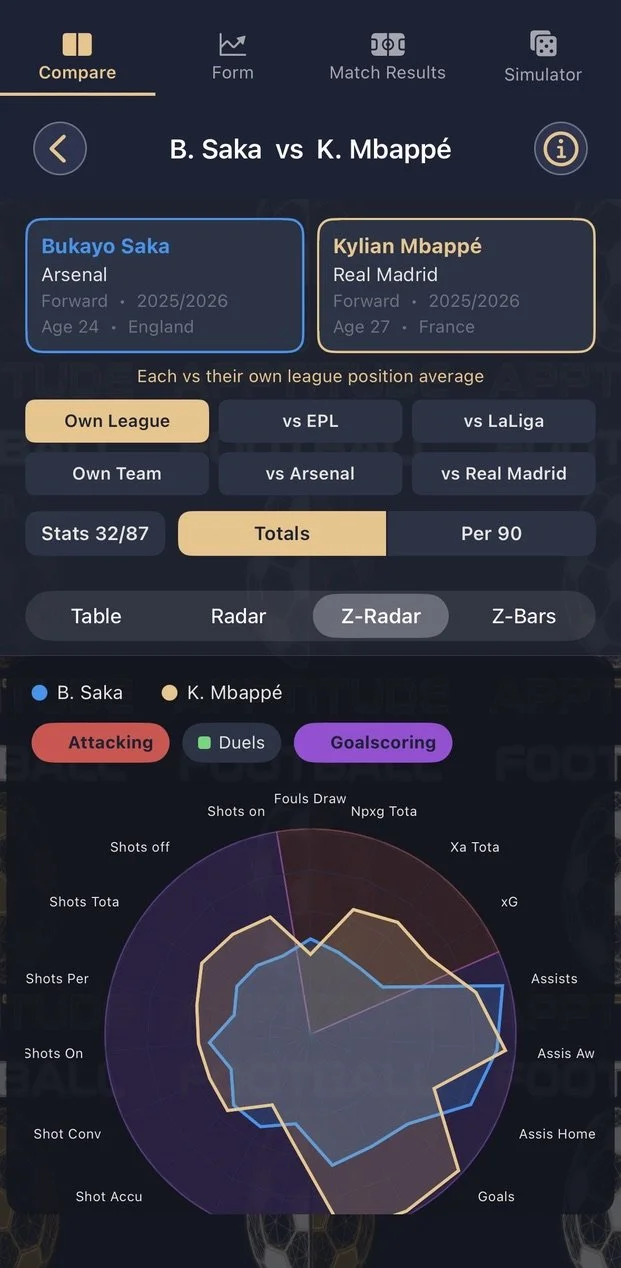
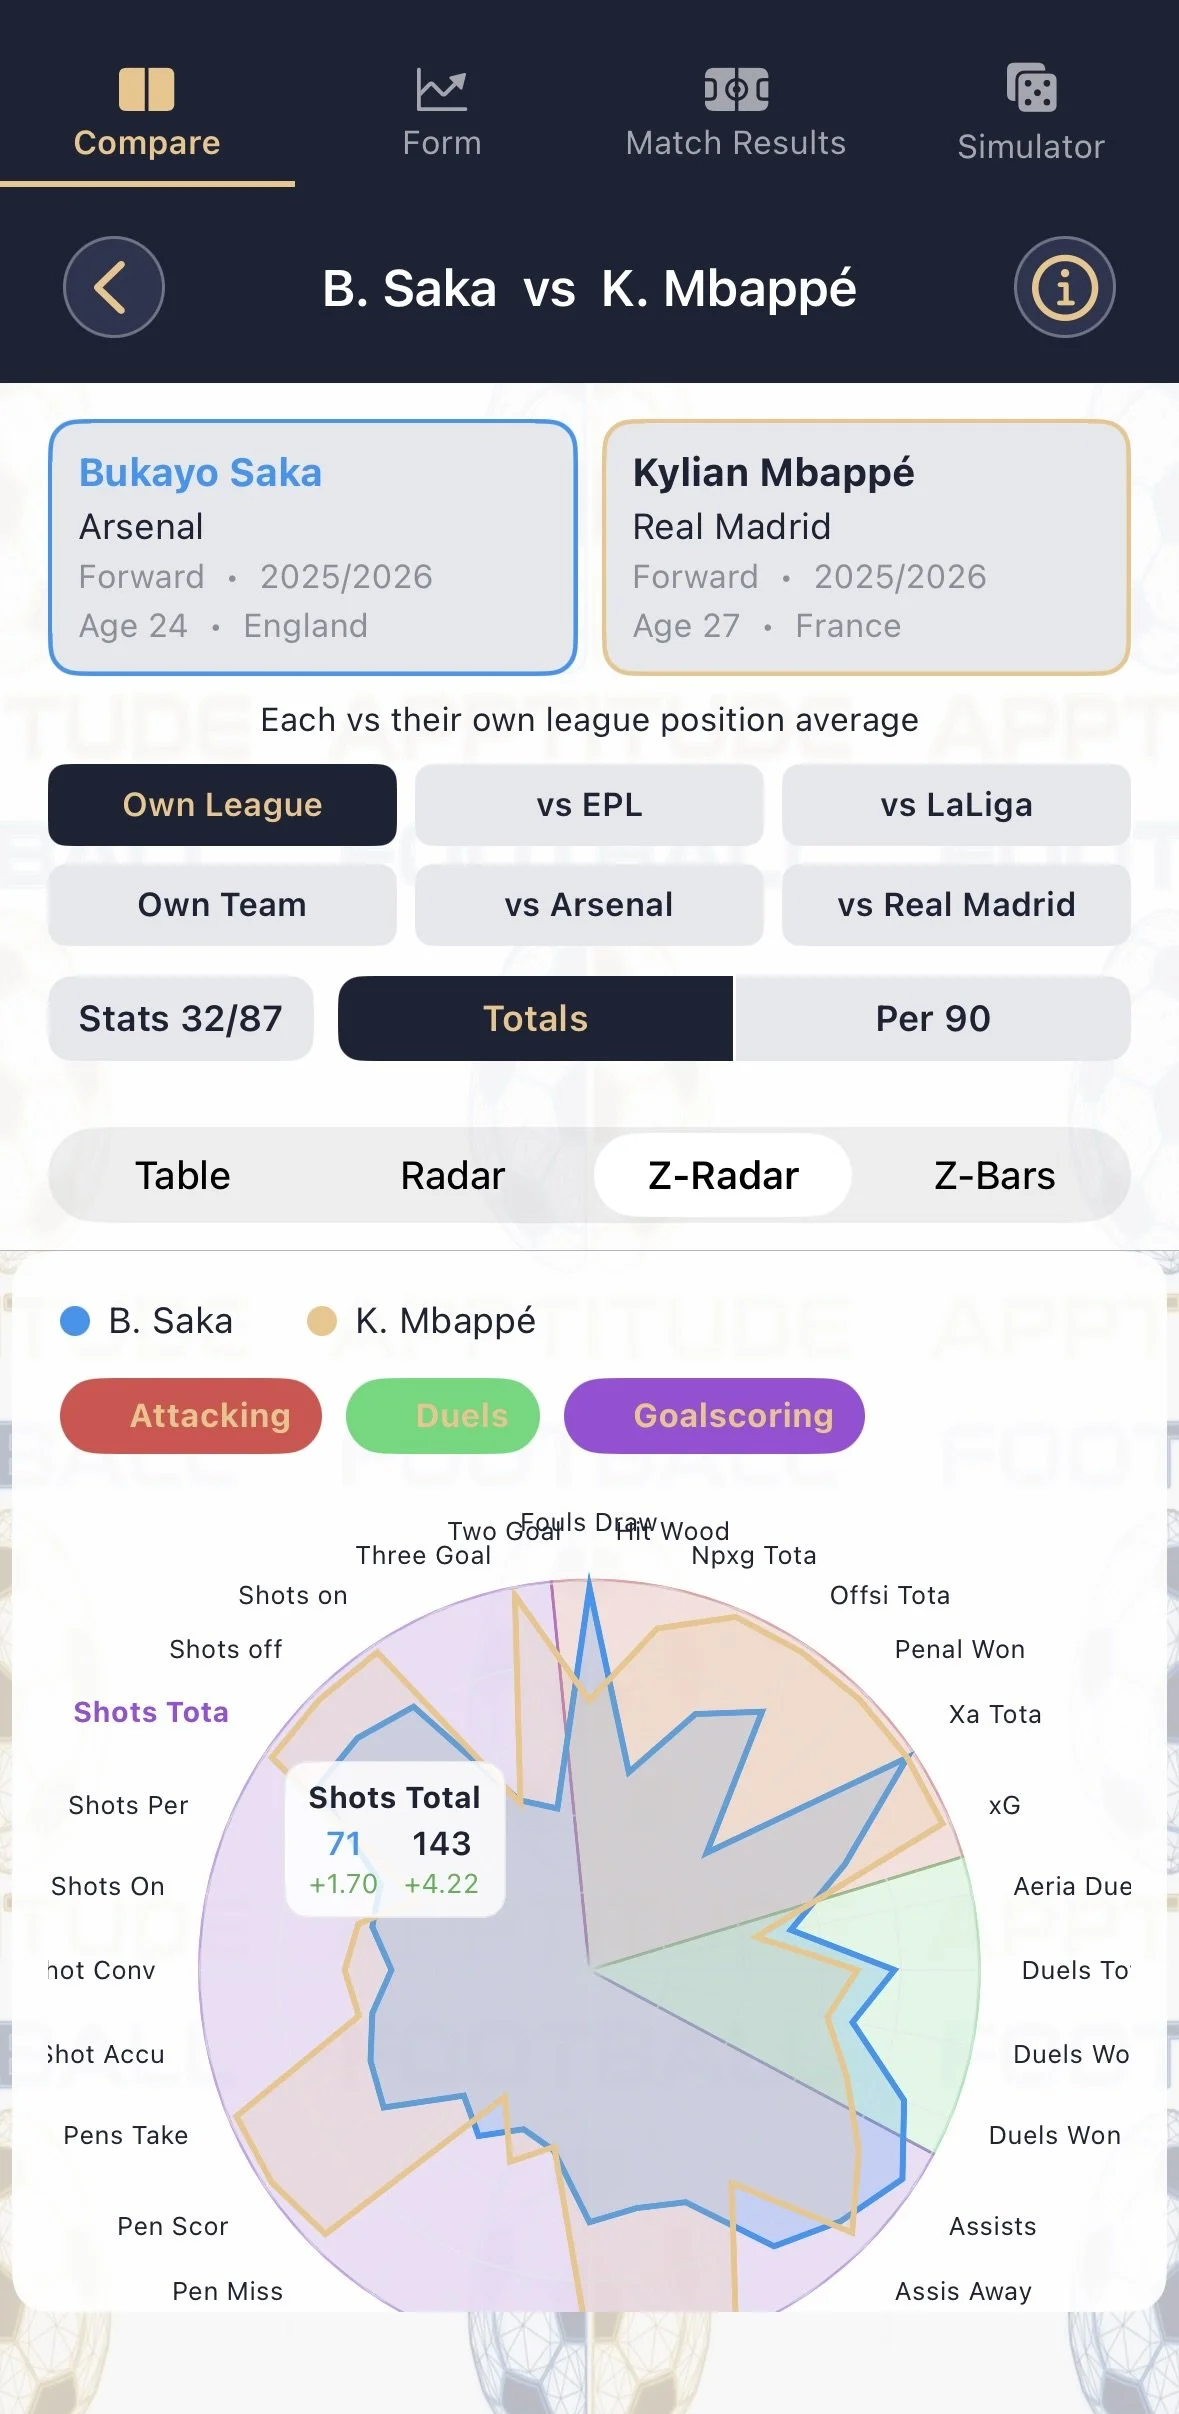
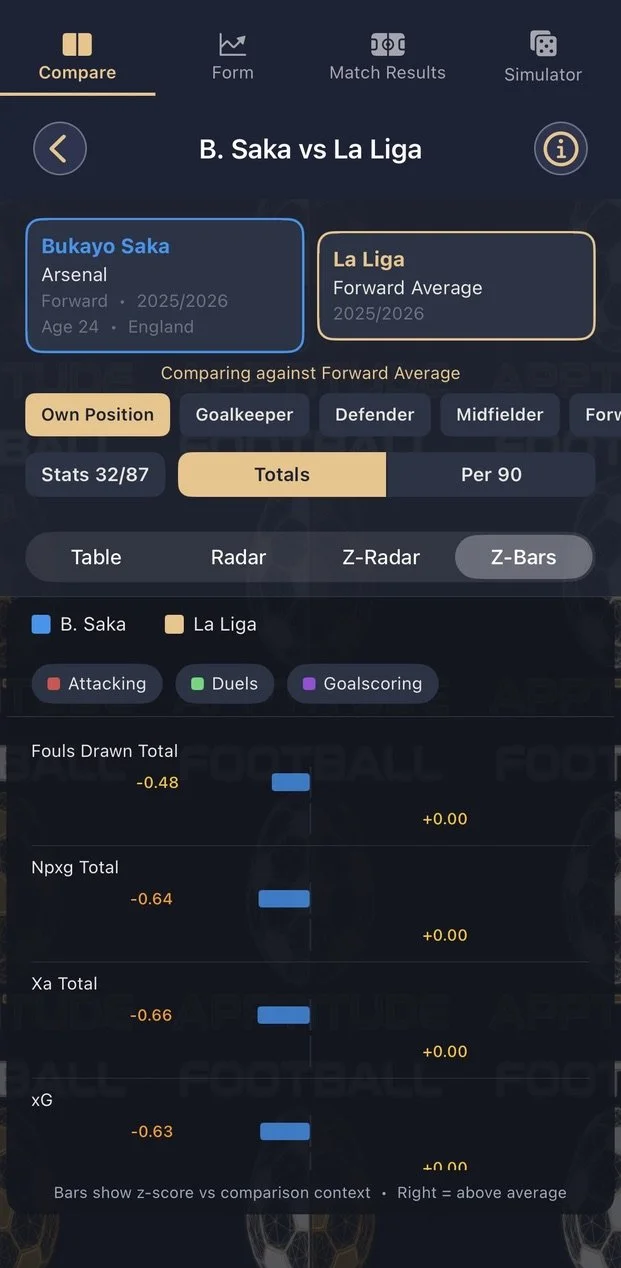
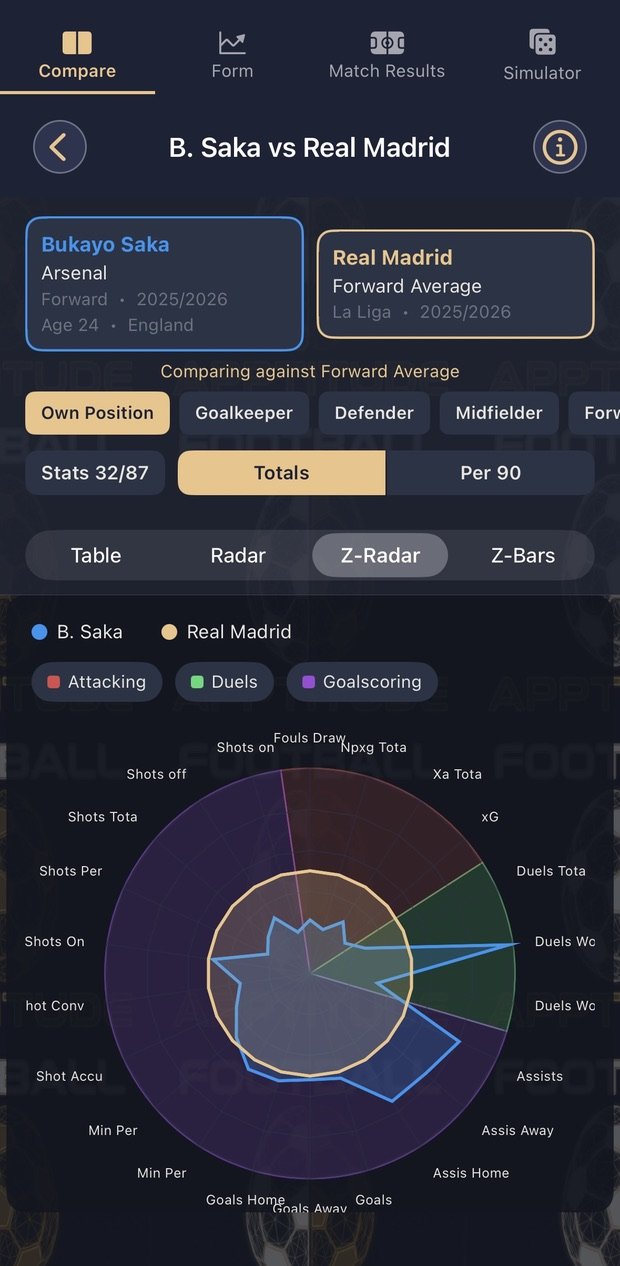
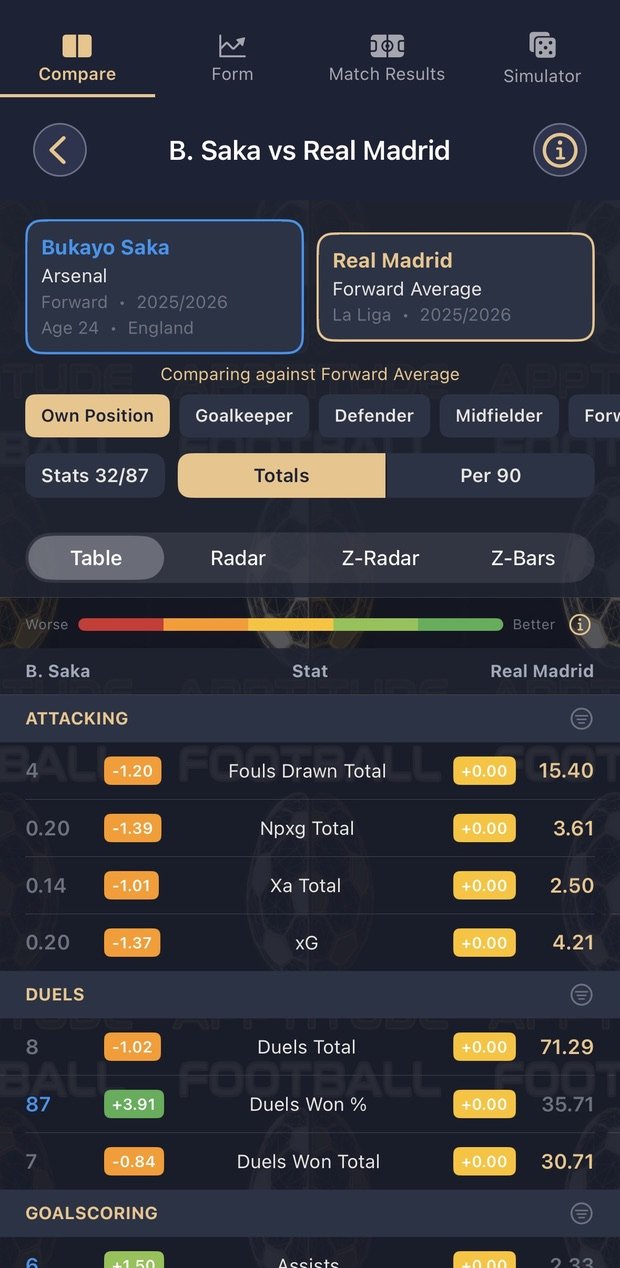
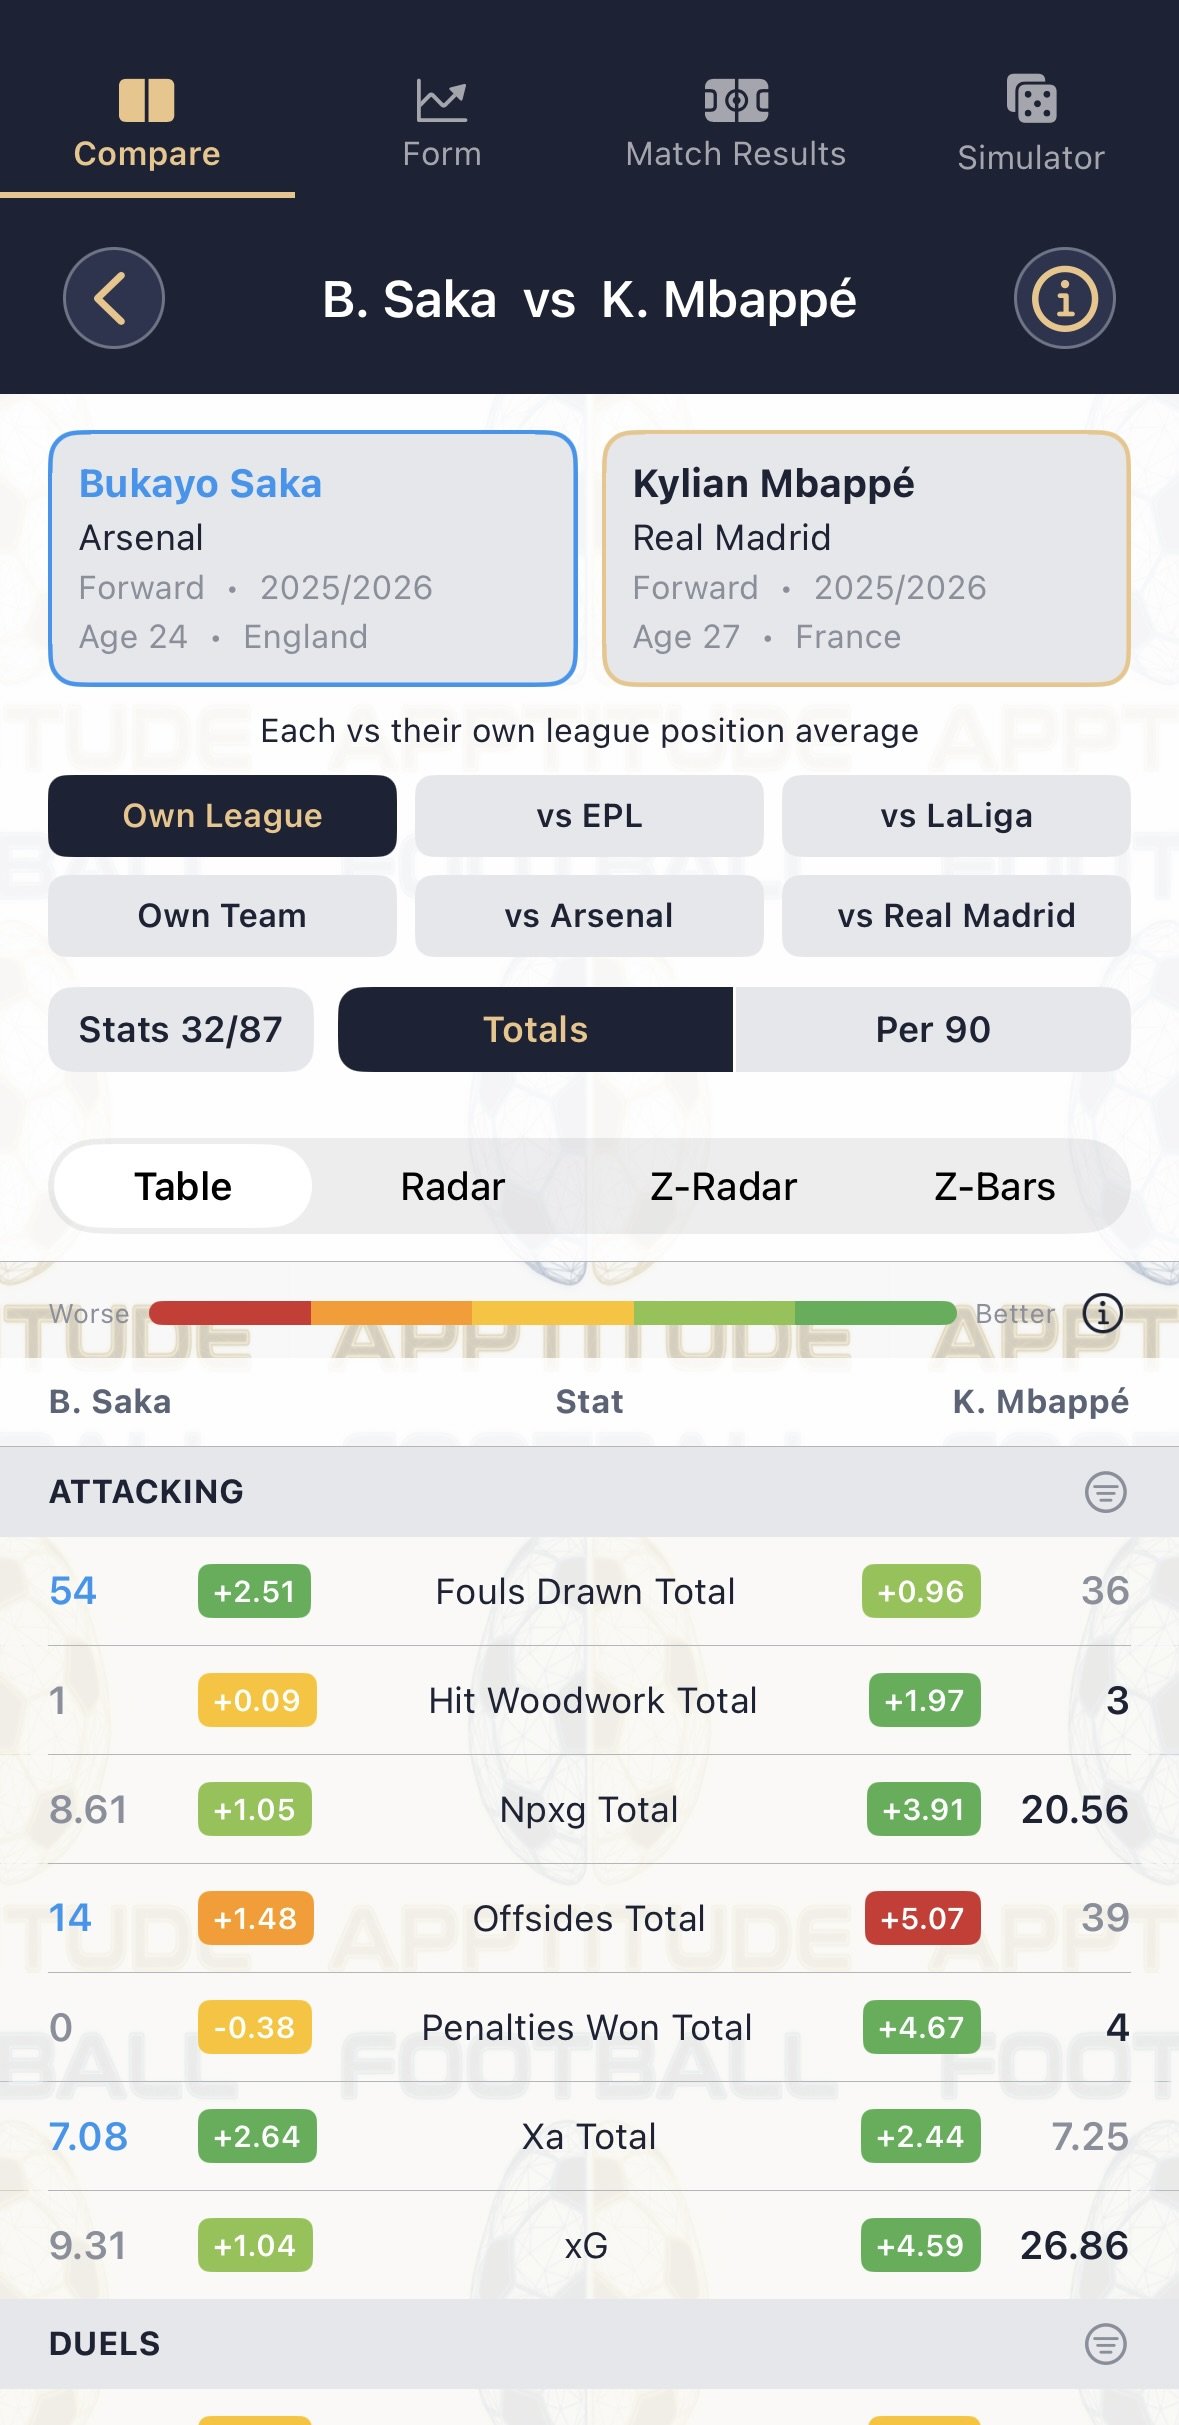
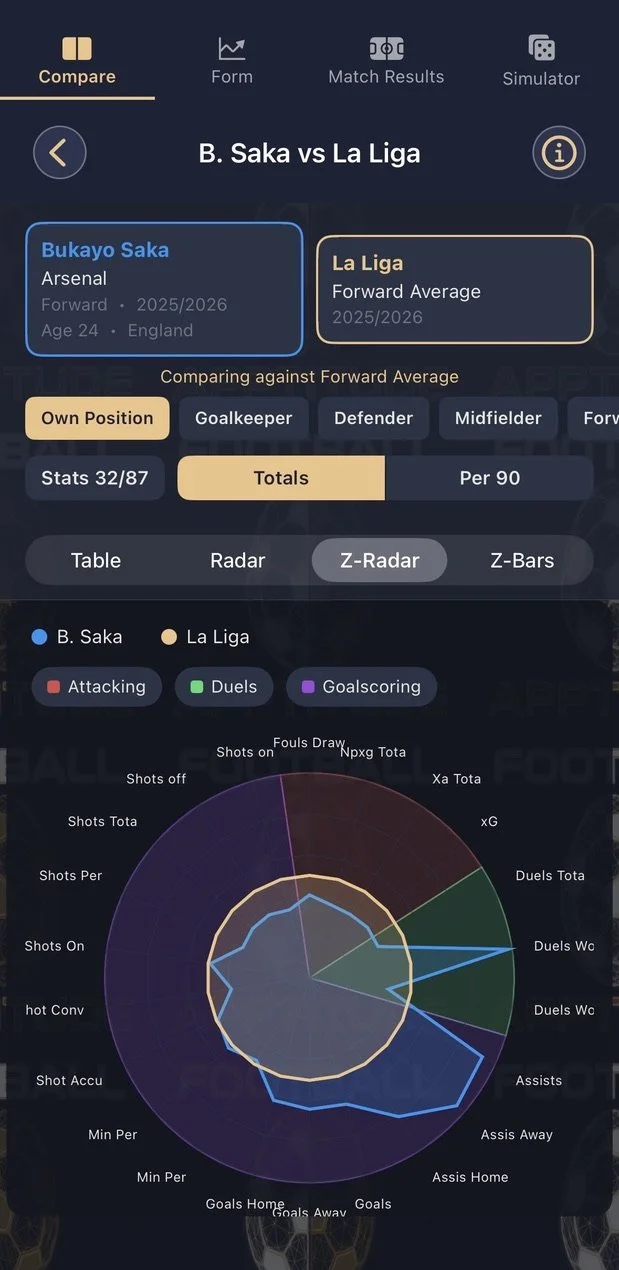
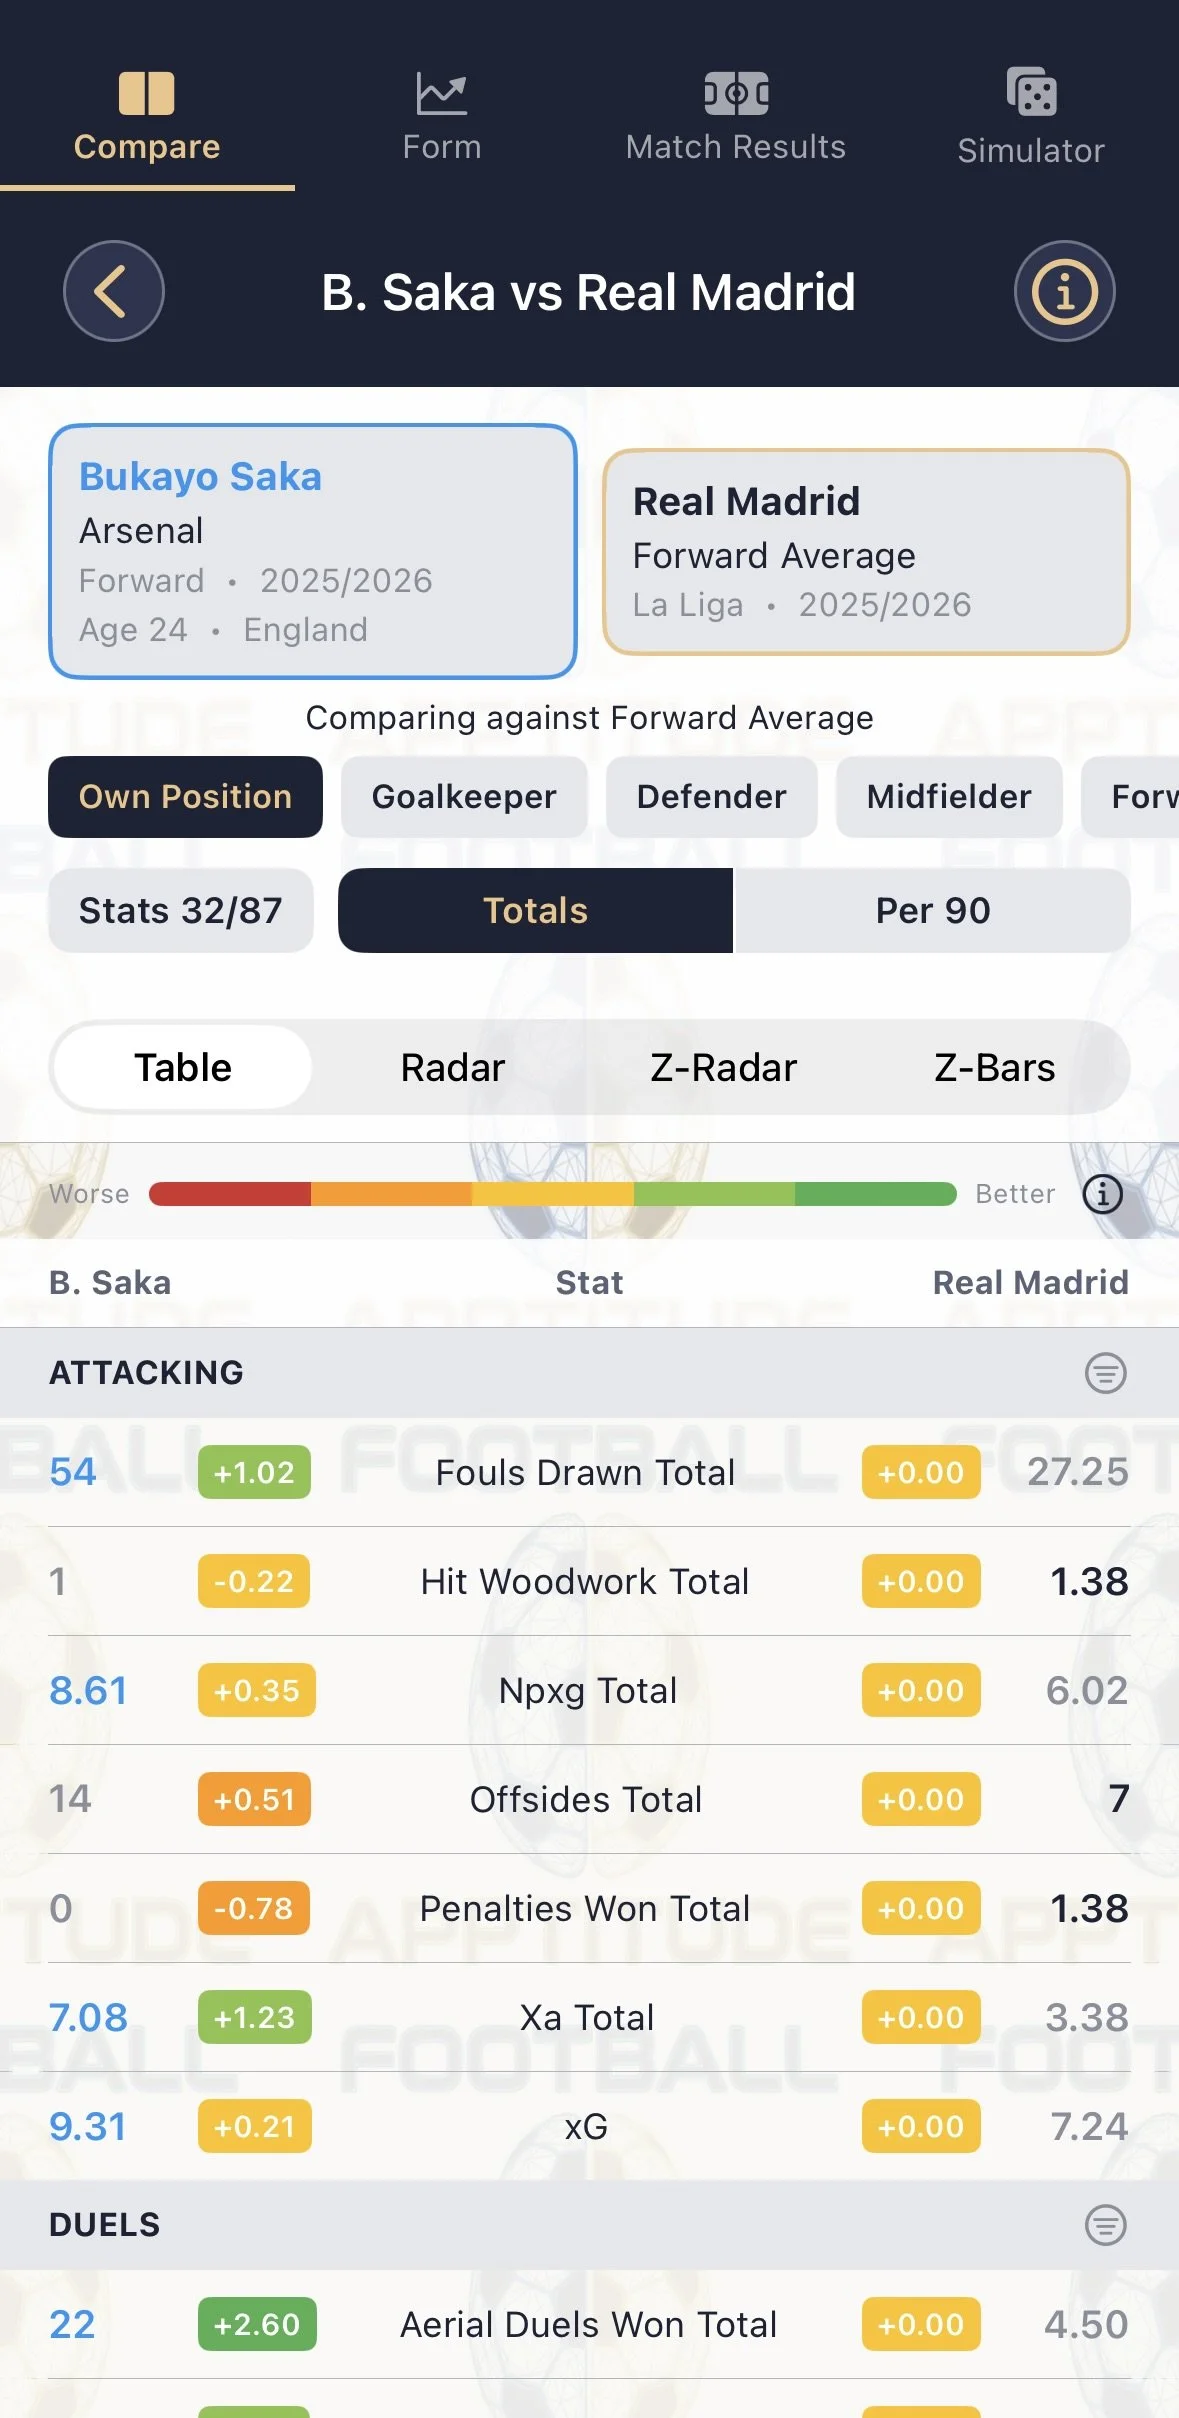
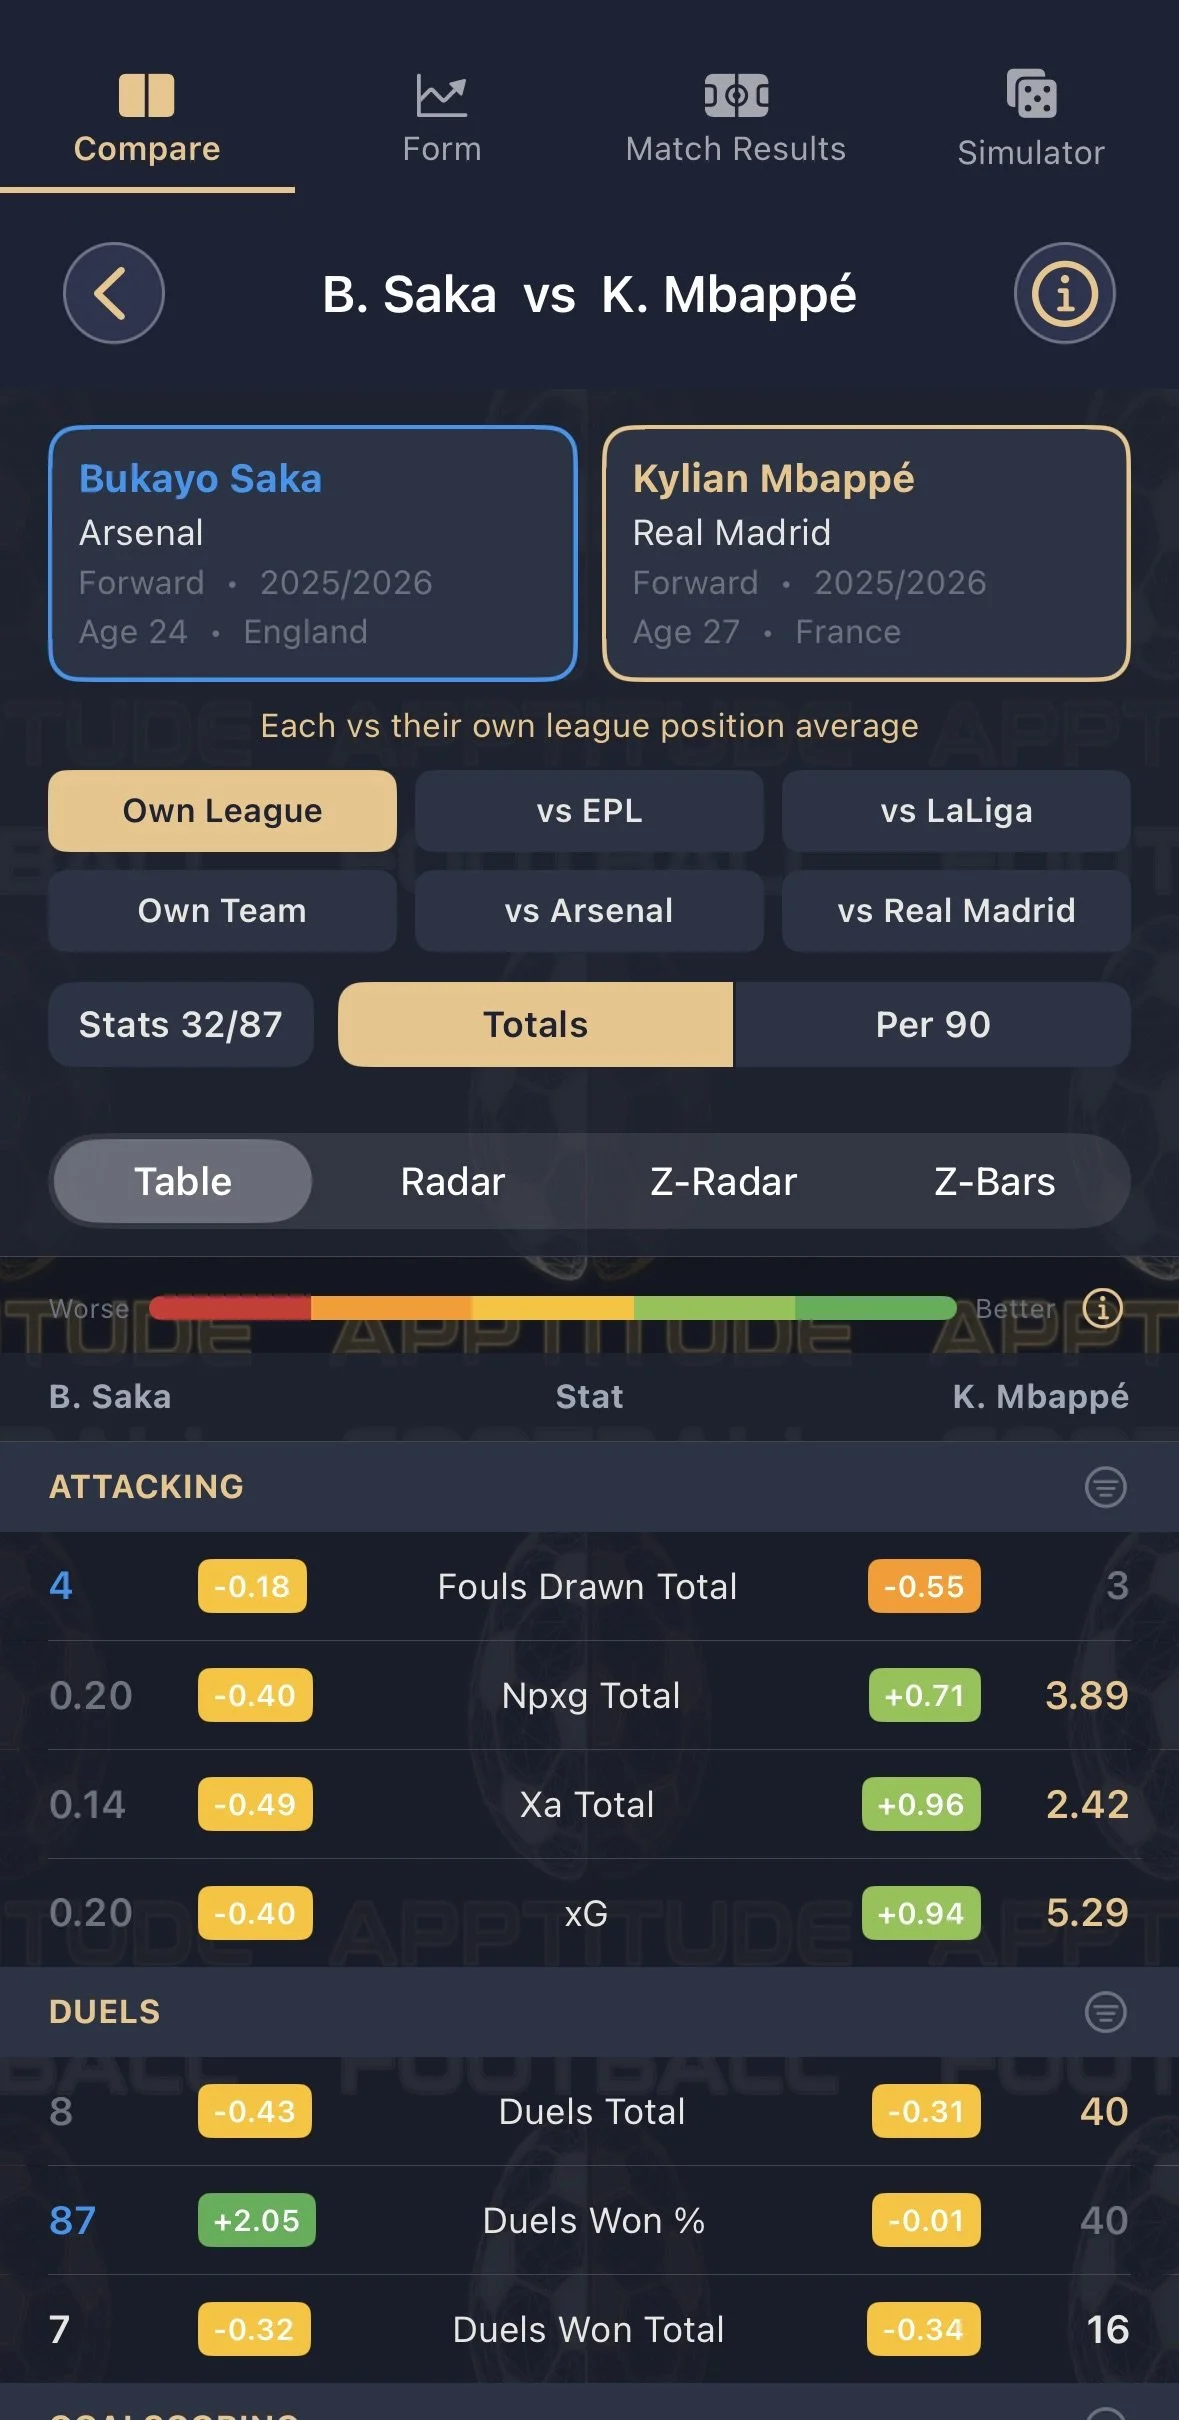
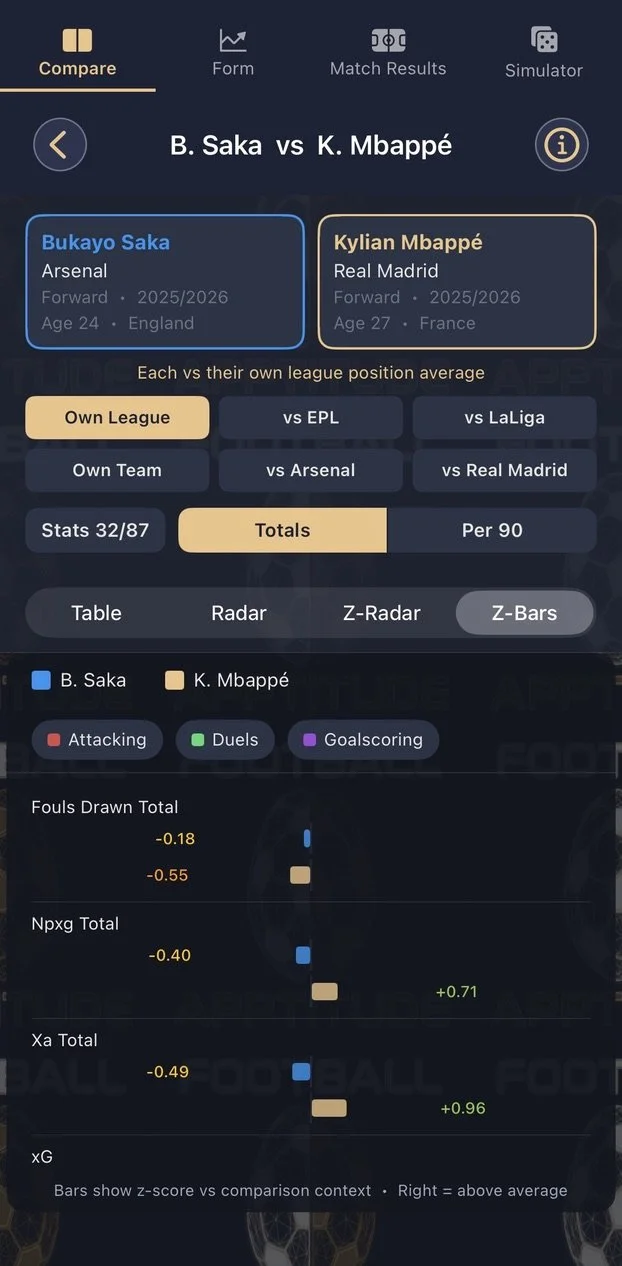
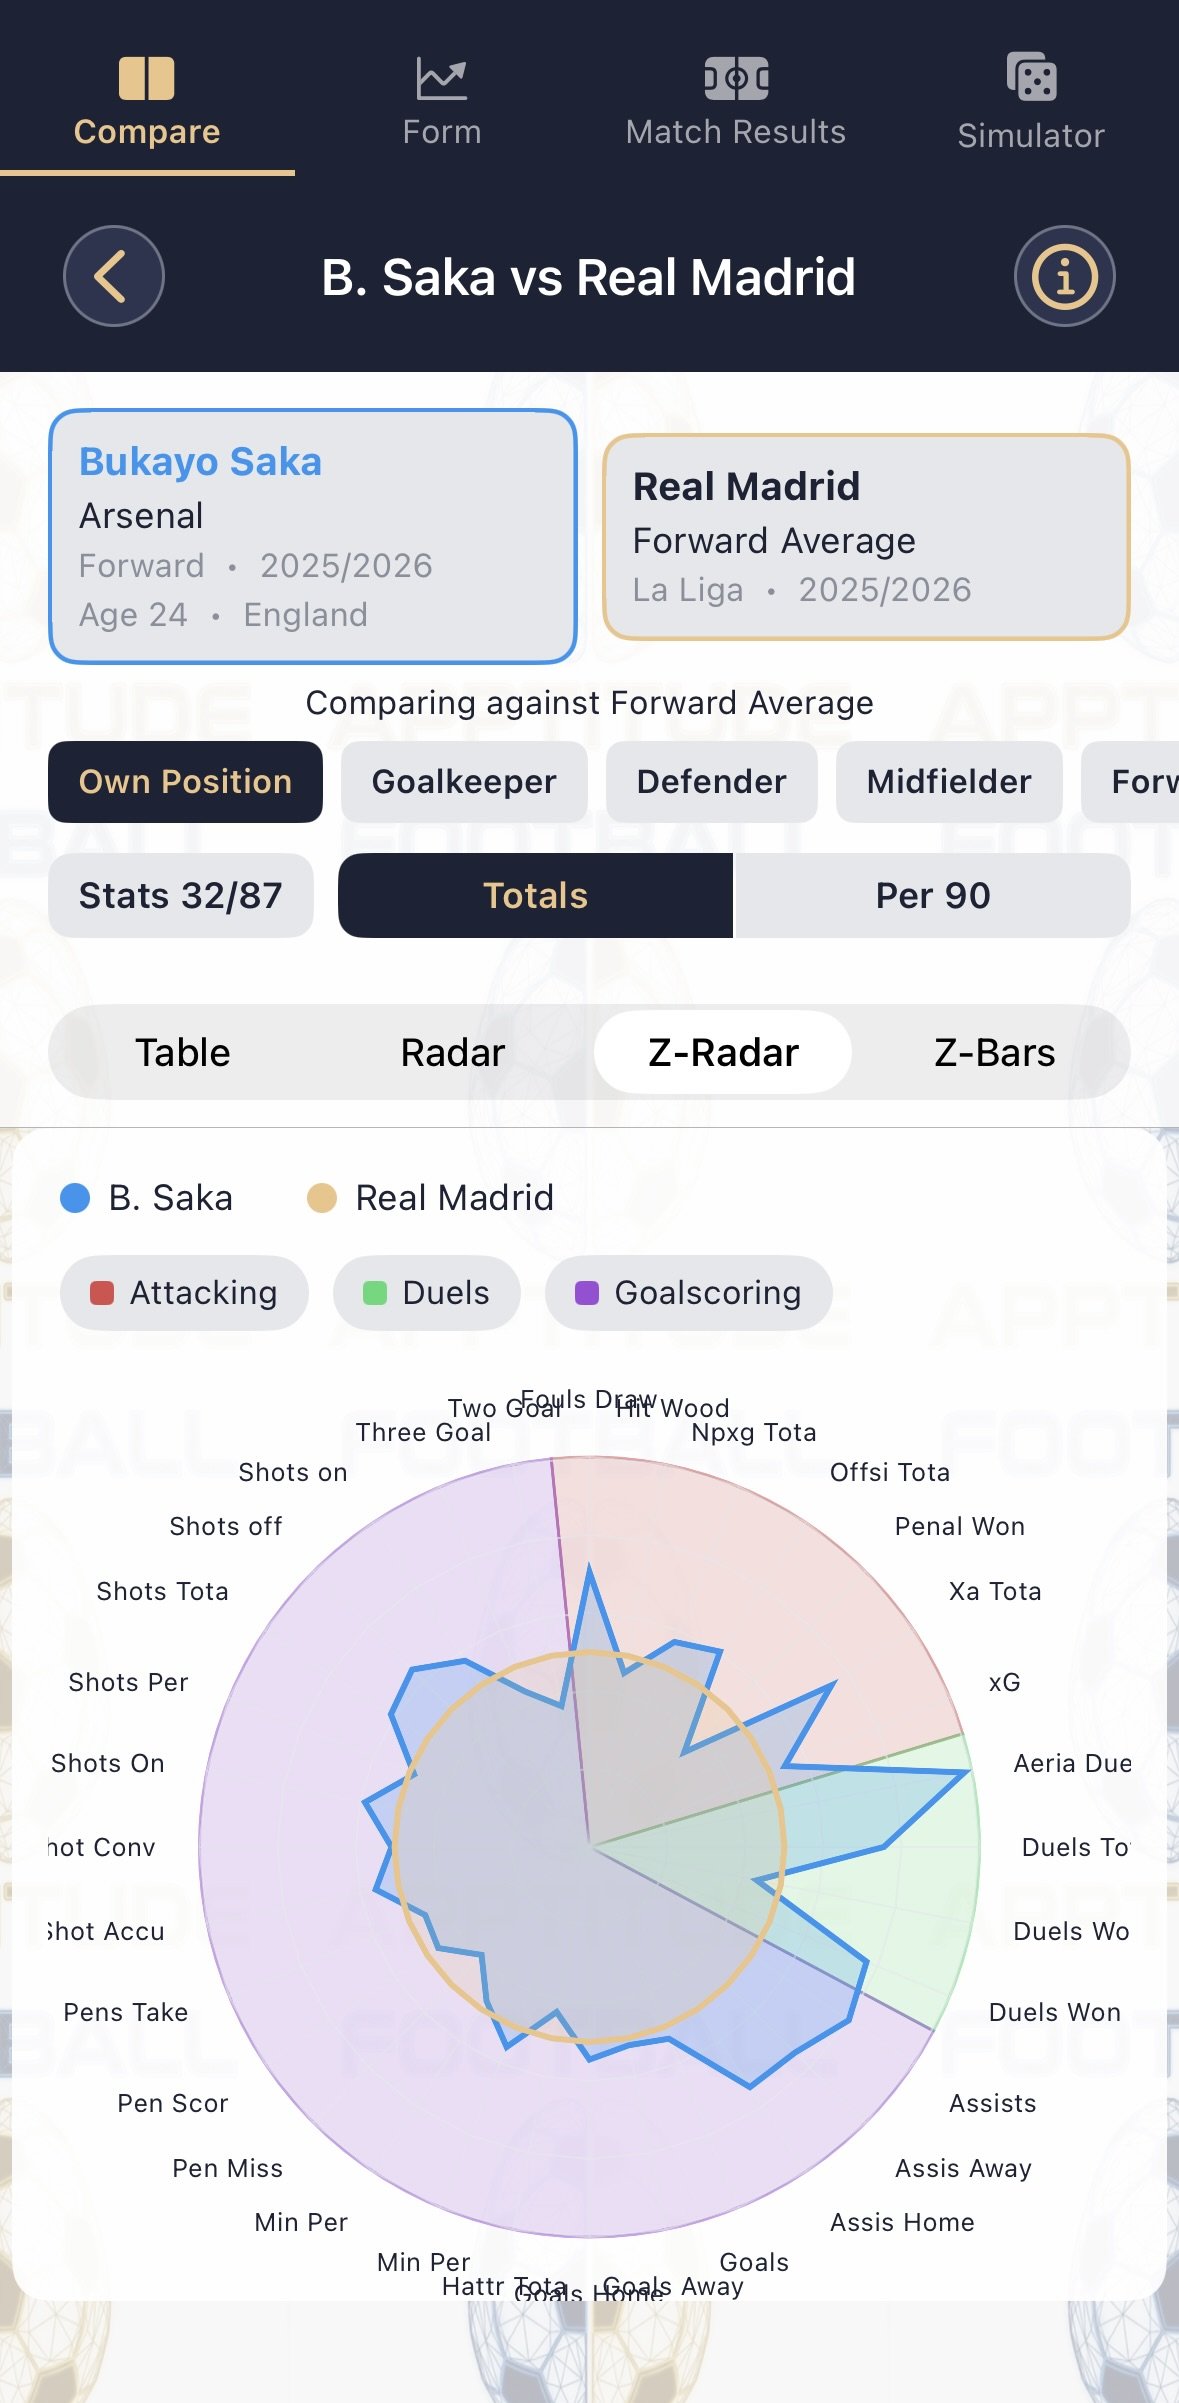
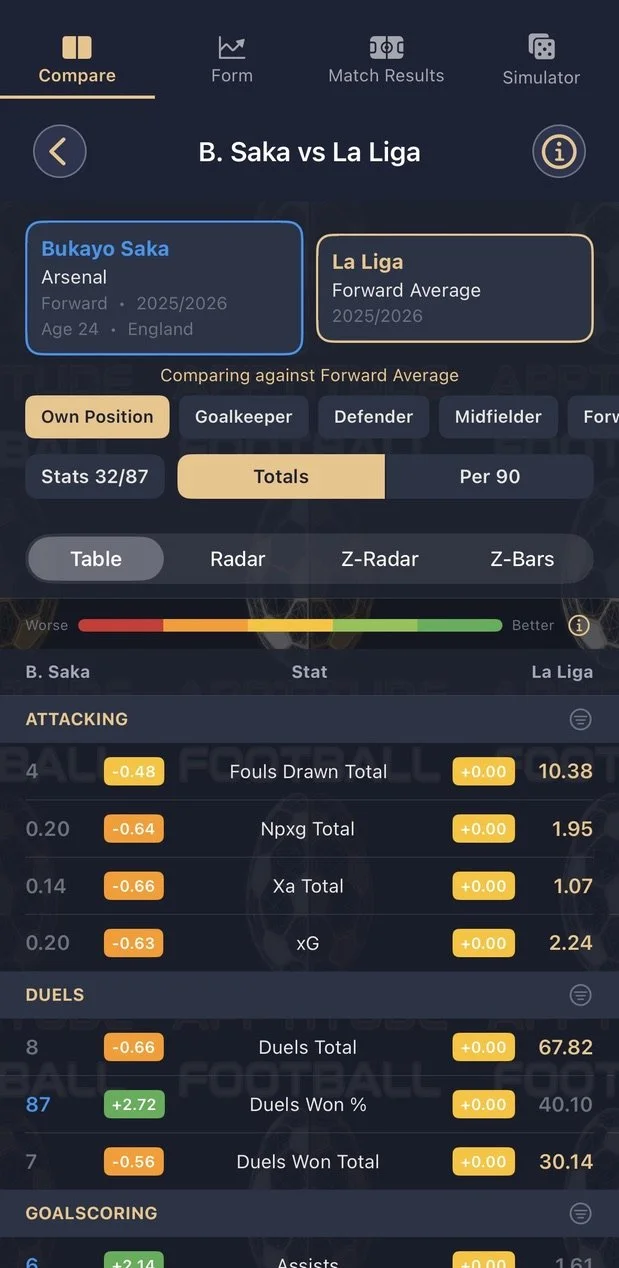
Three comparison types (Player vs Player, Player vs Team and Player vs League), each with multiple filters and visualisation modes including z-score normalised comparisons.
-
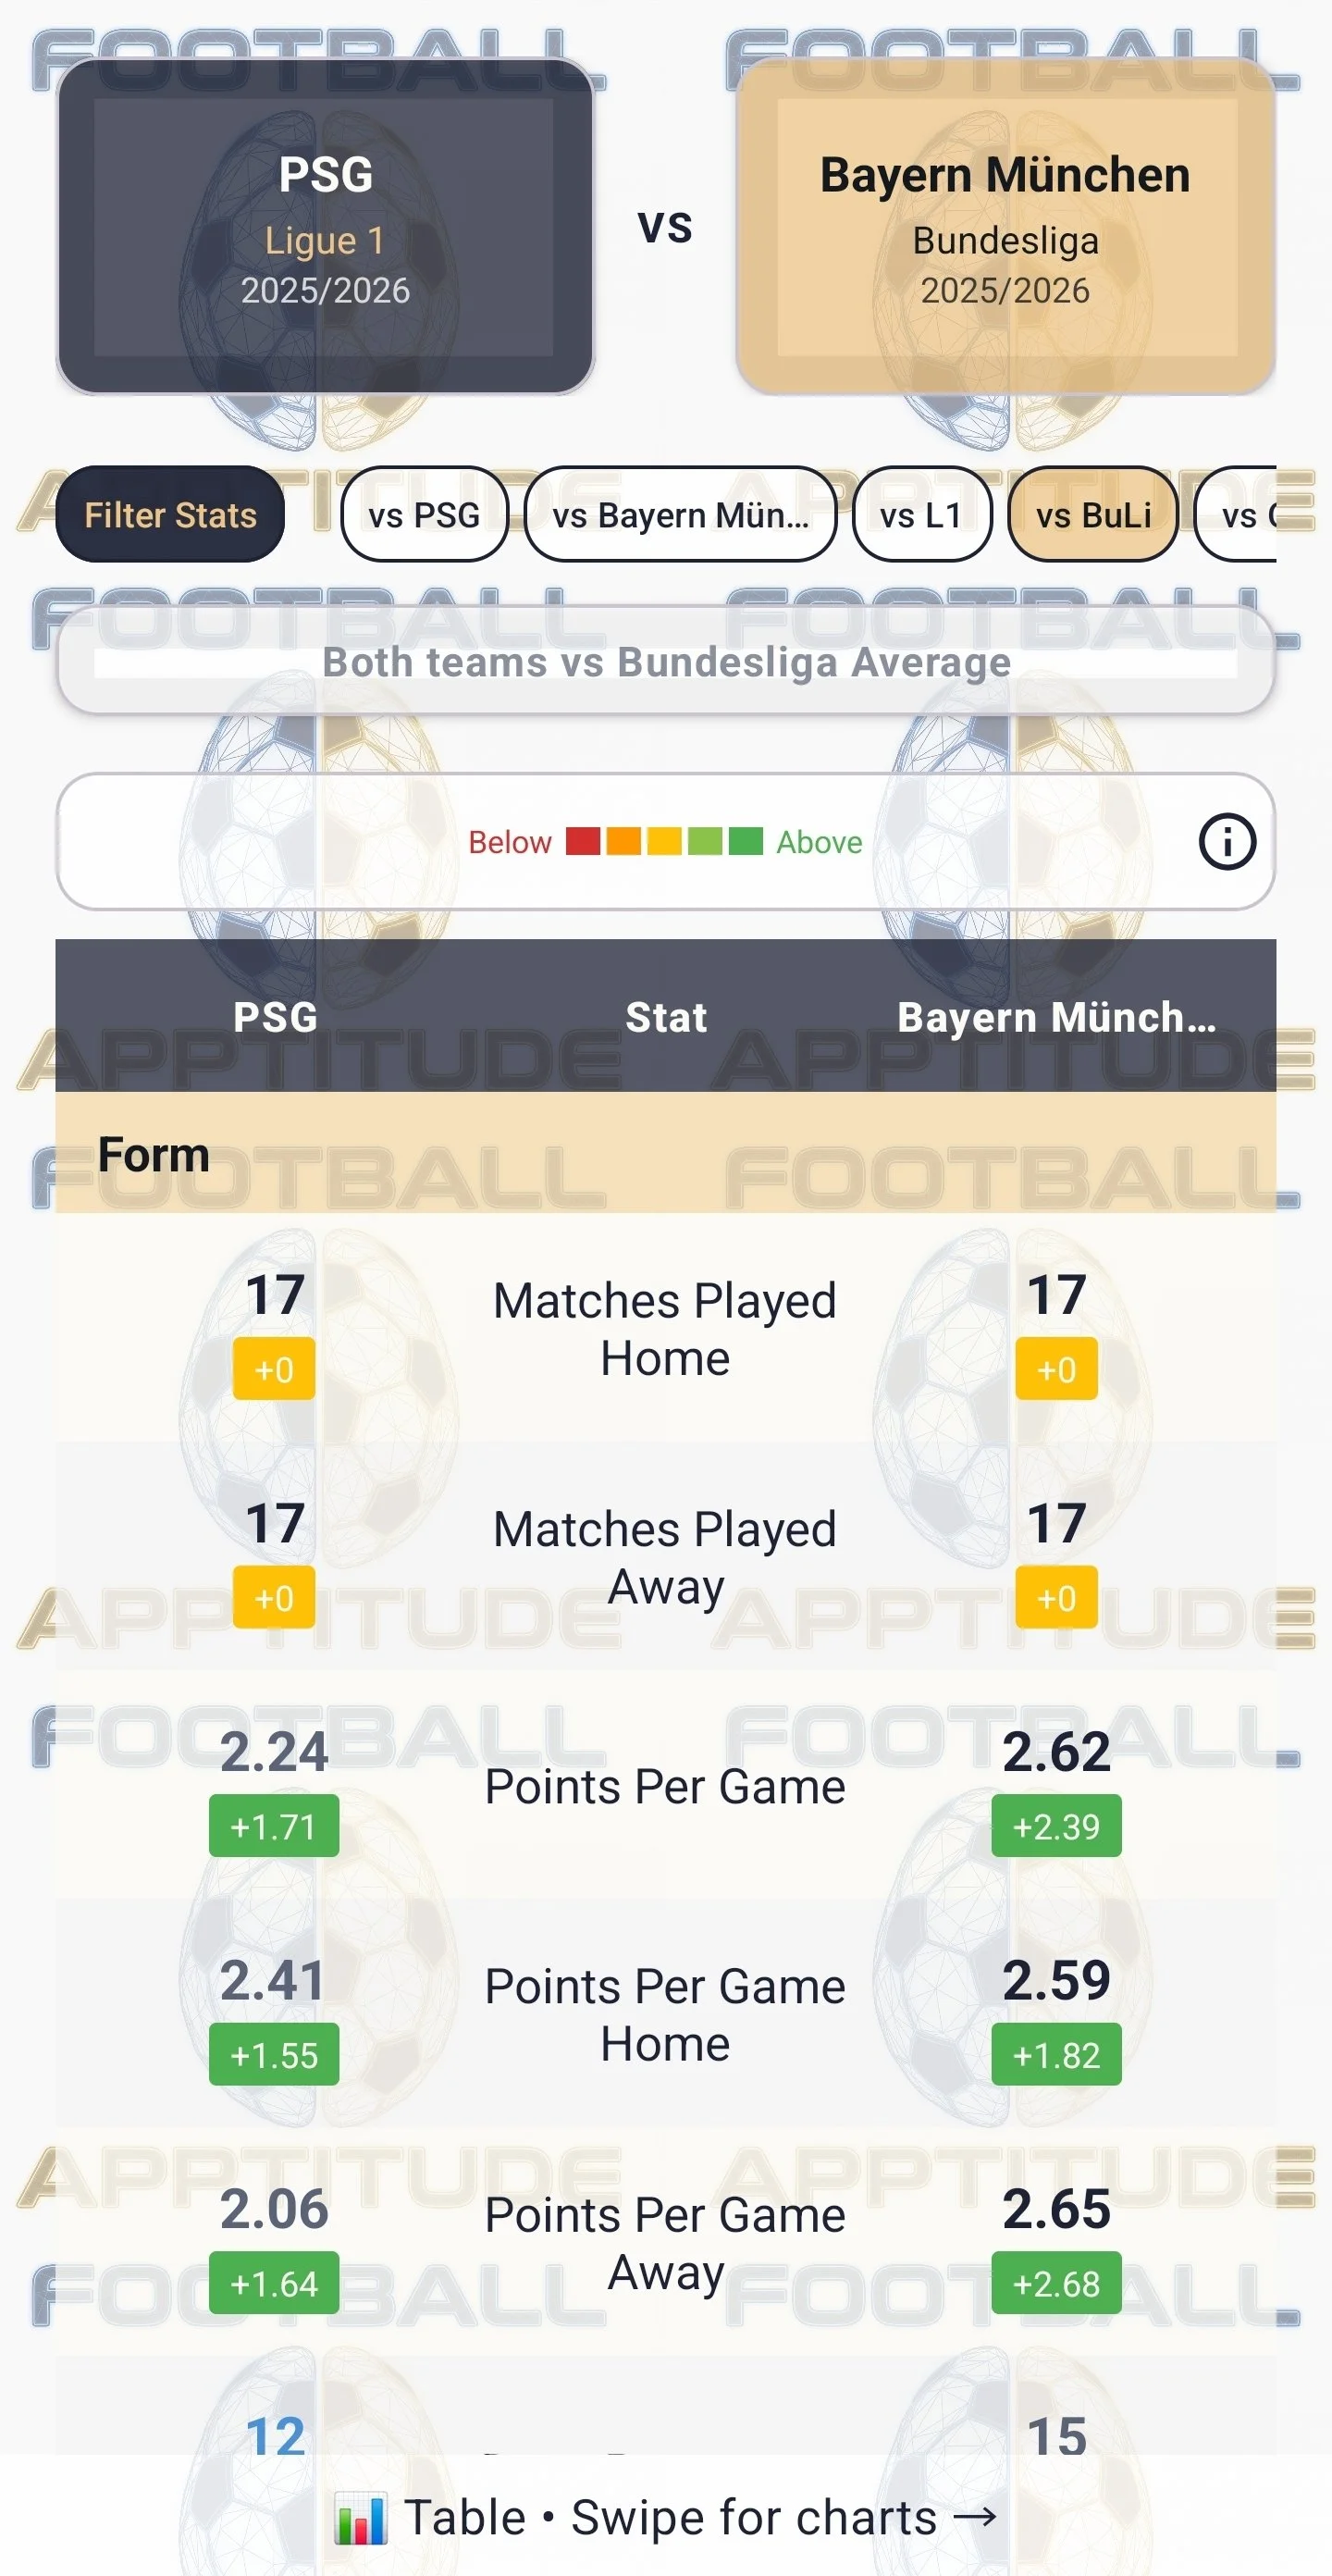
Two comparison types (Team vs Team, Team vs League), each with multiple filters and visualisation modes including z-score normalised comparisons.
-
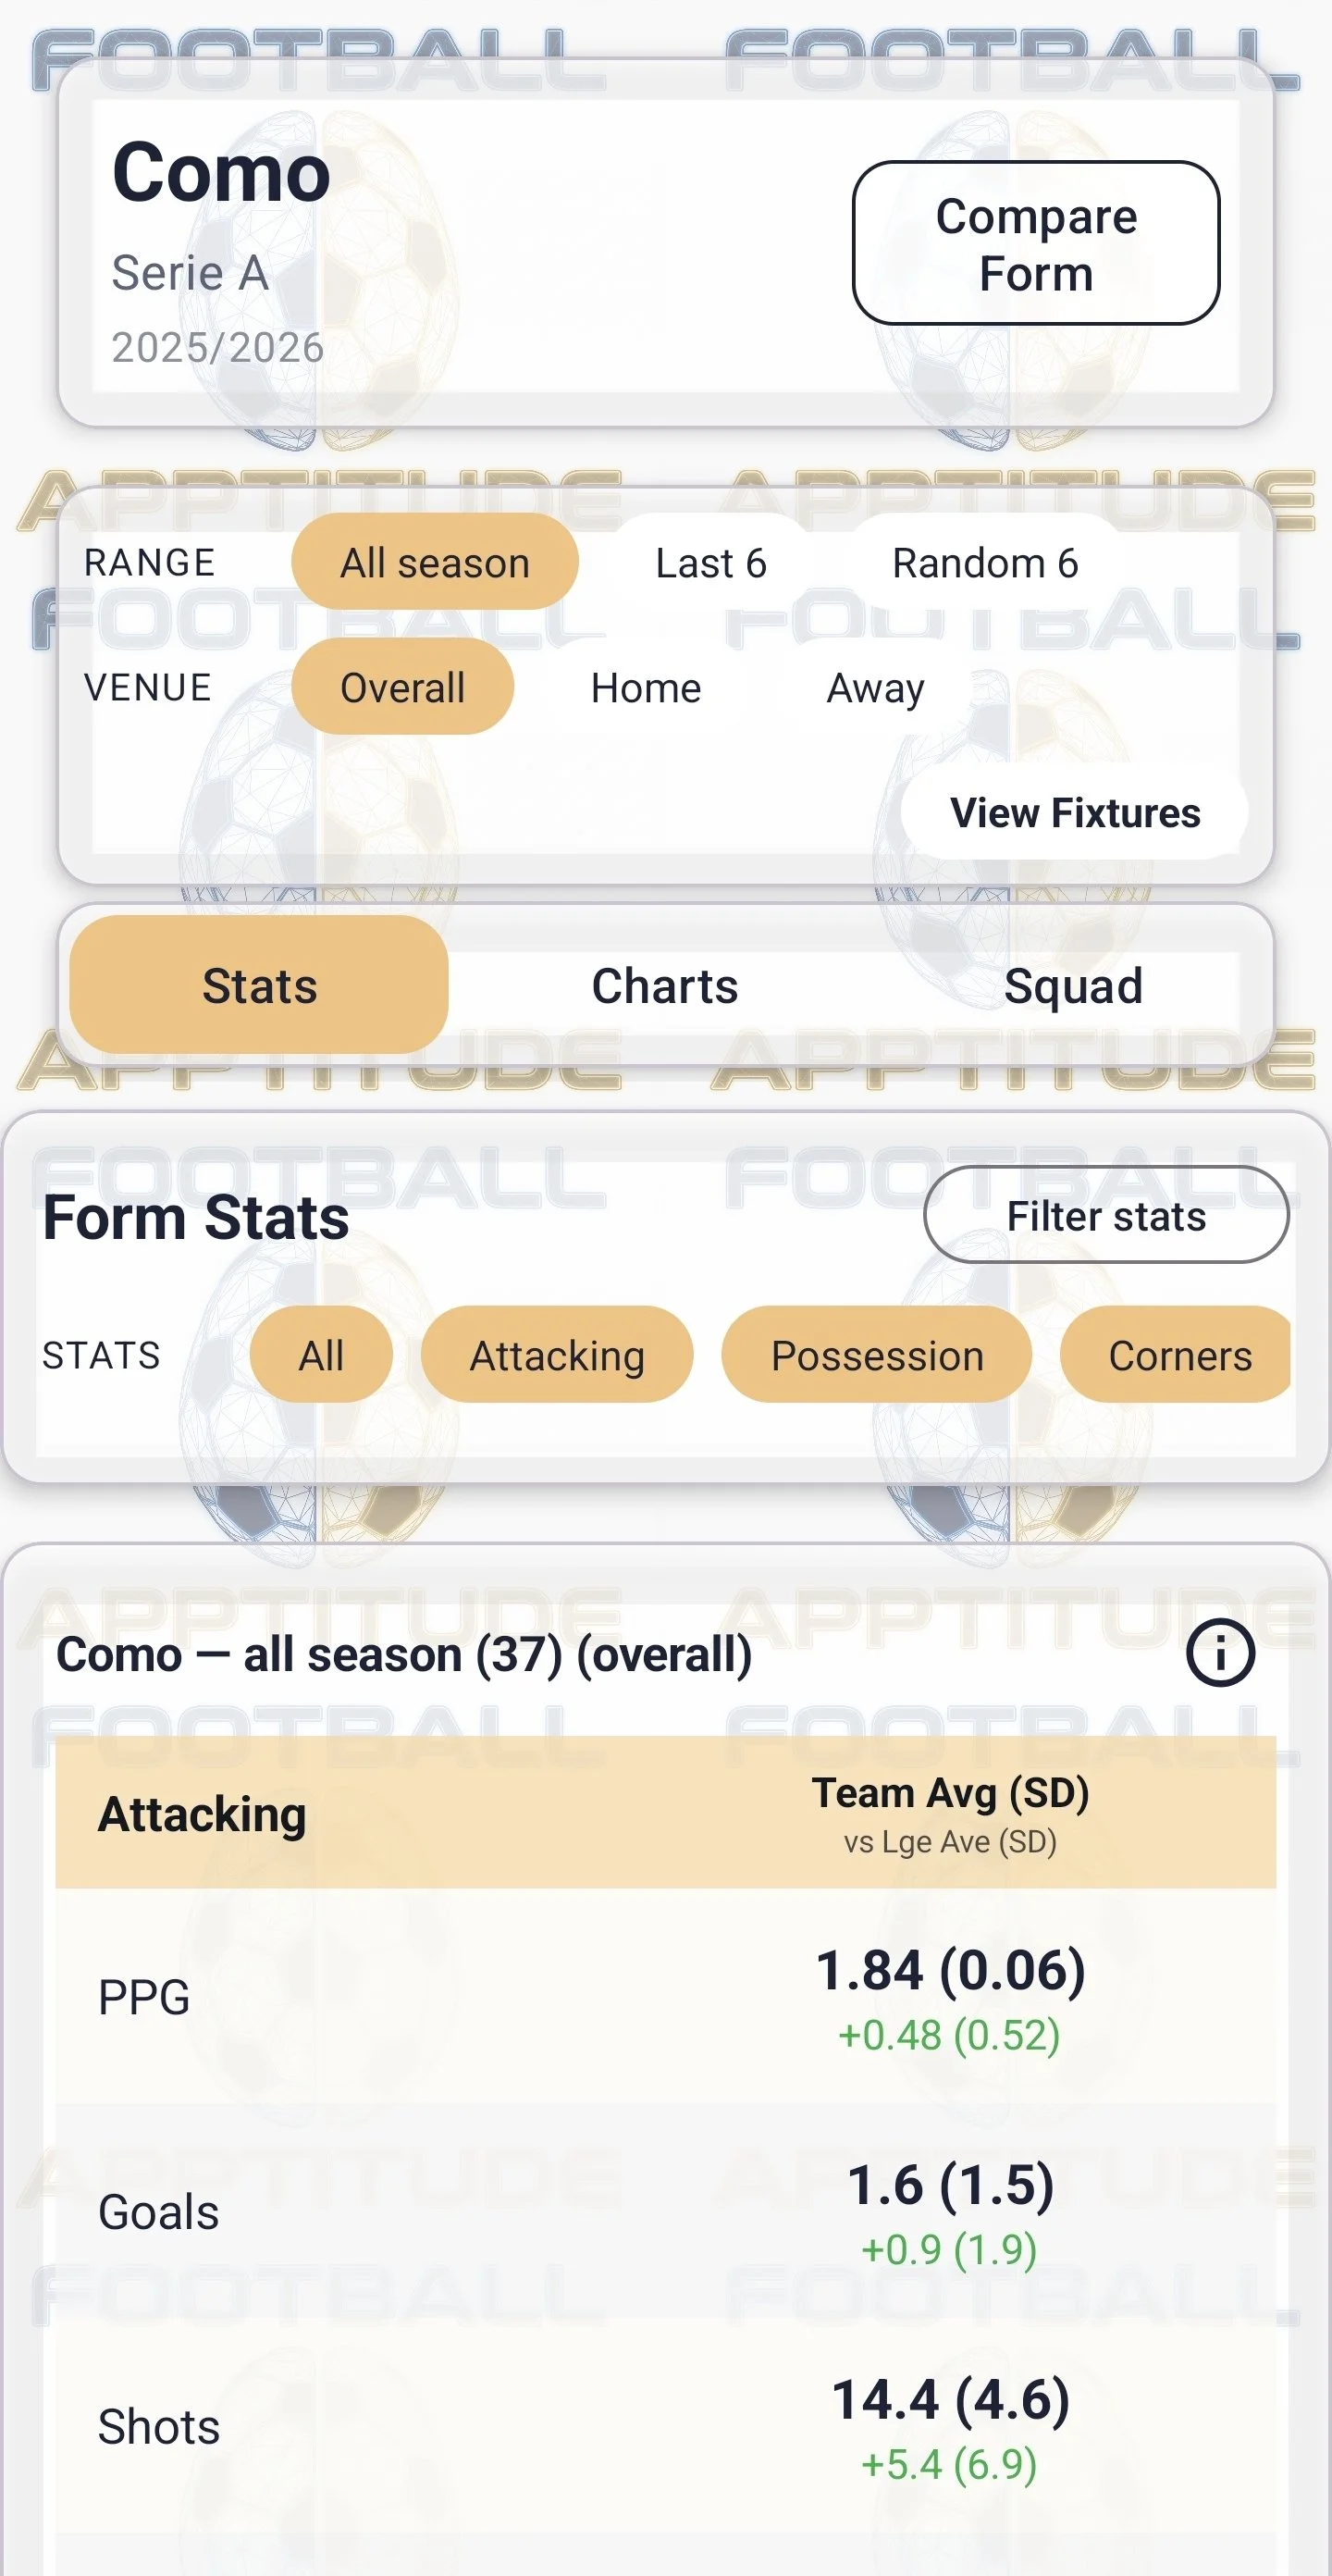
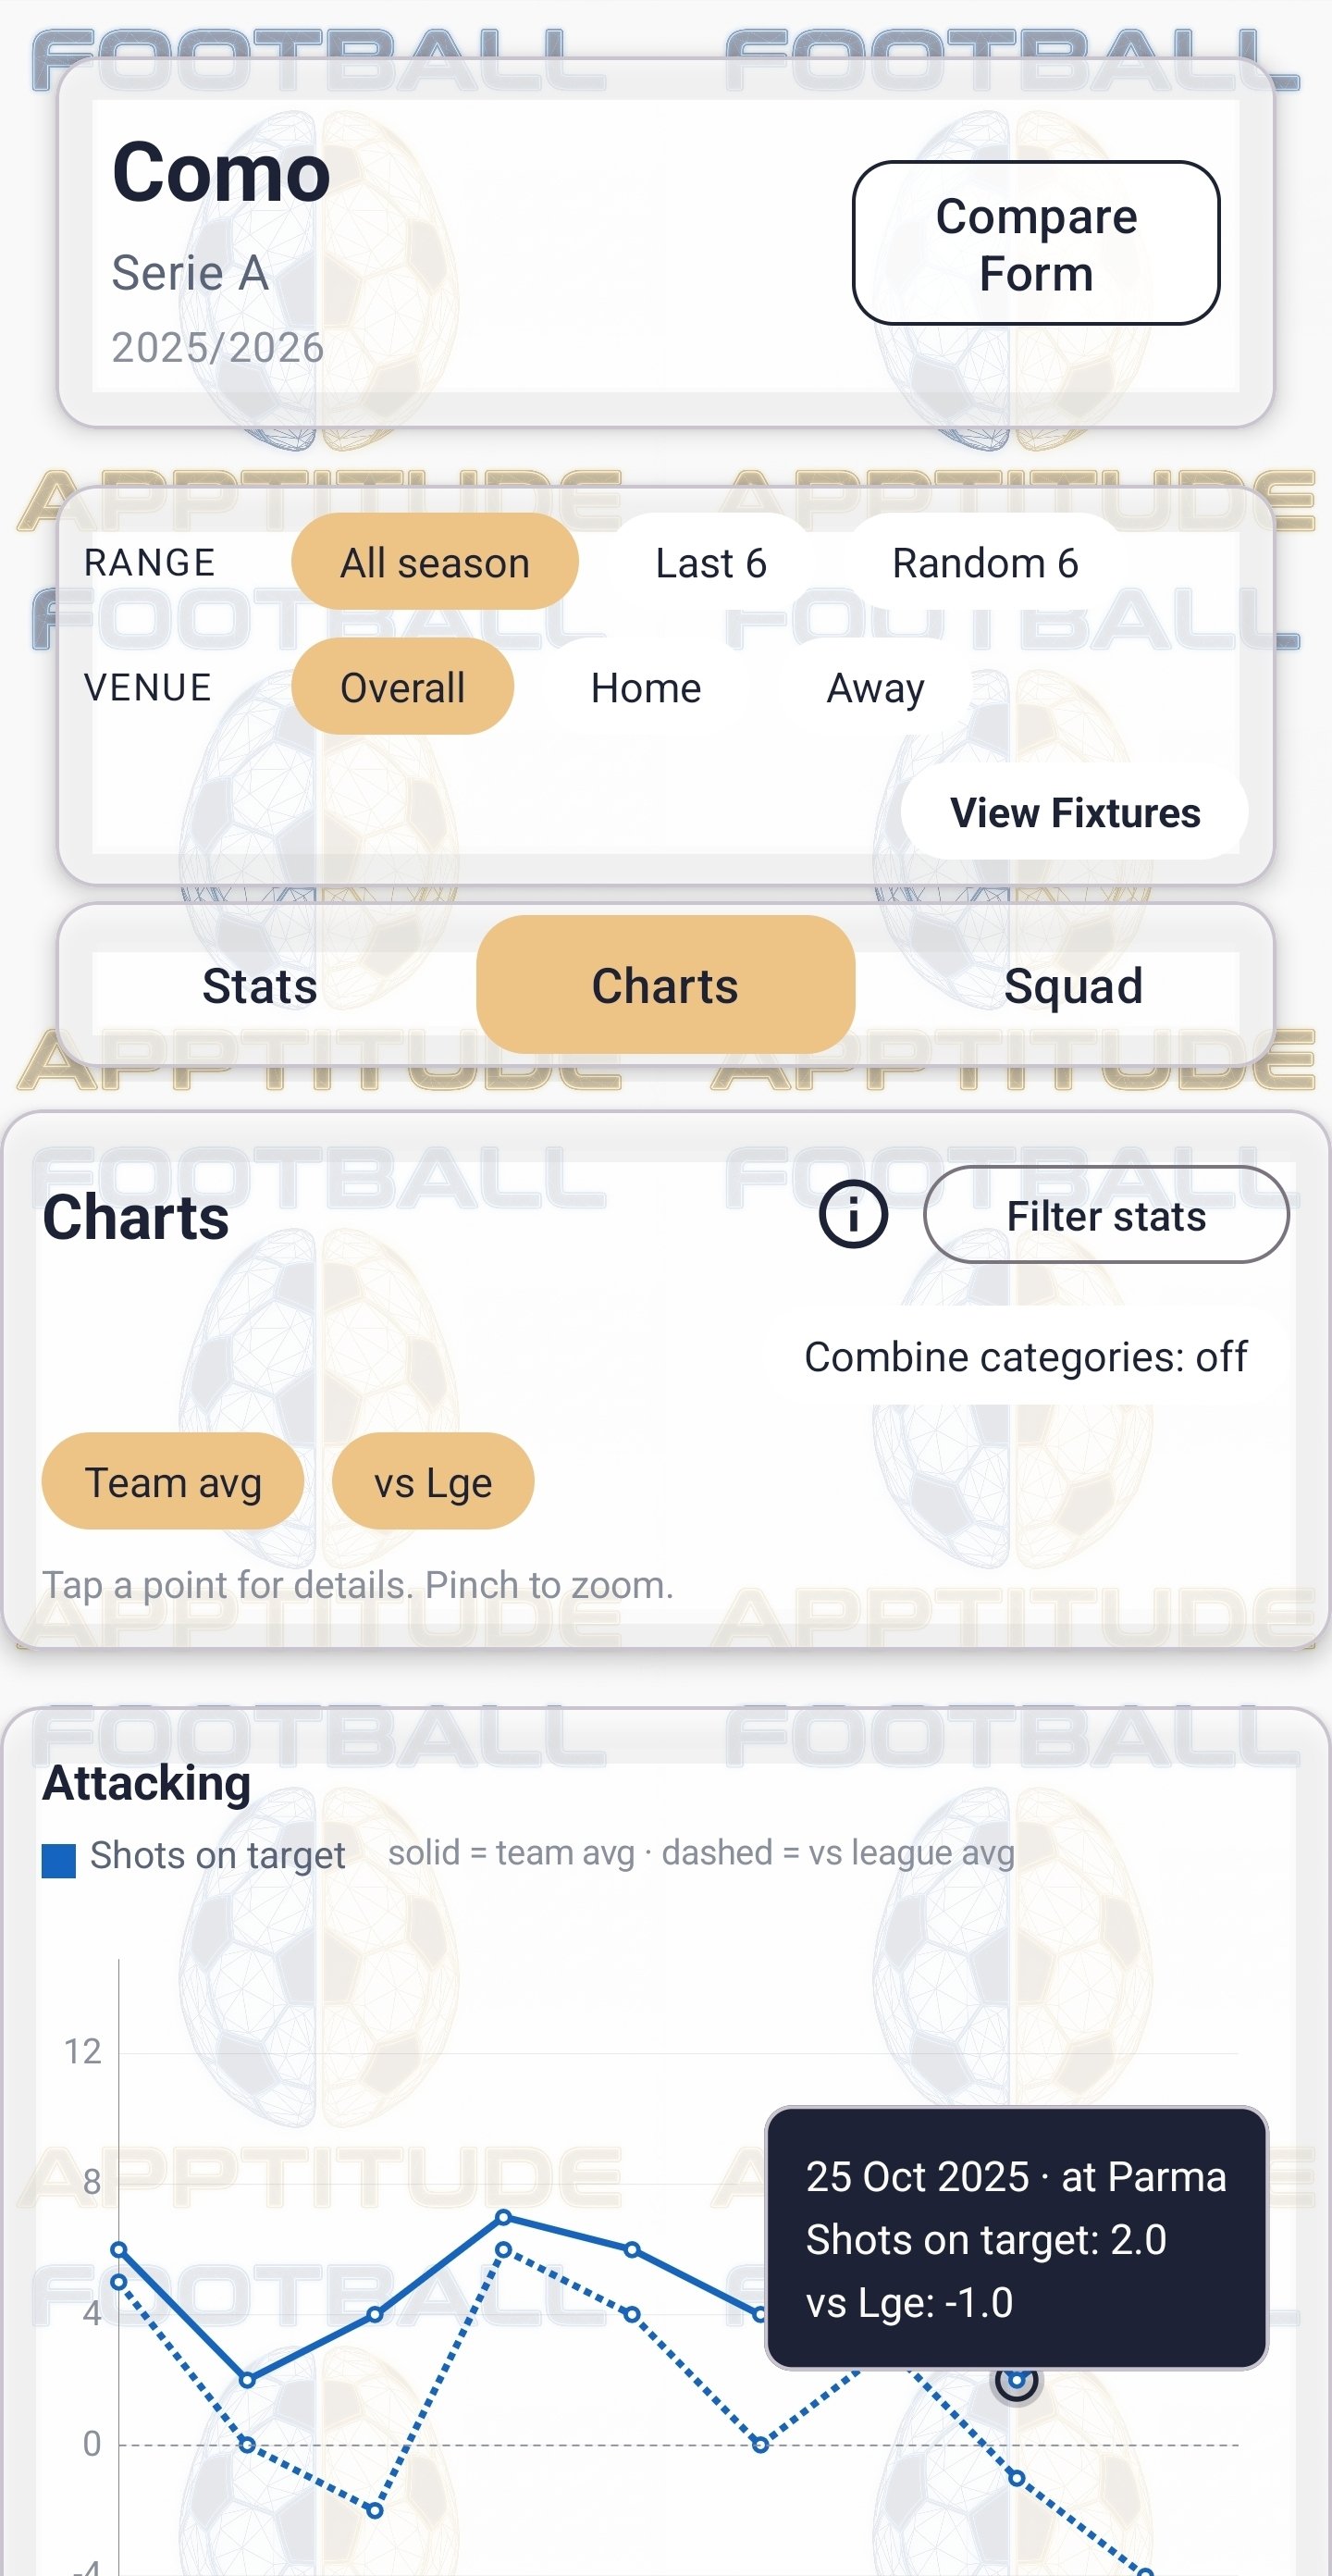
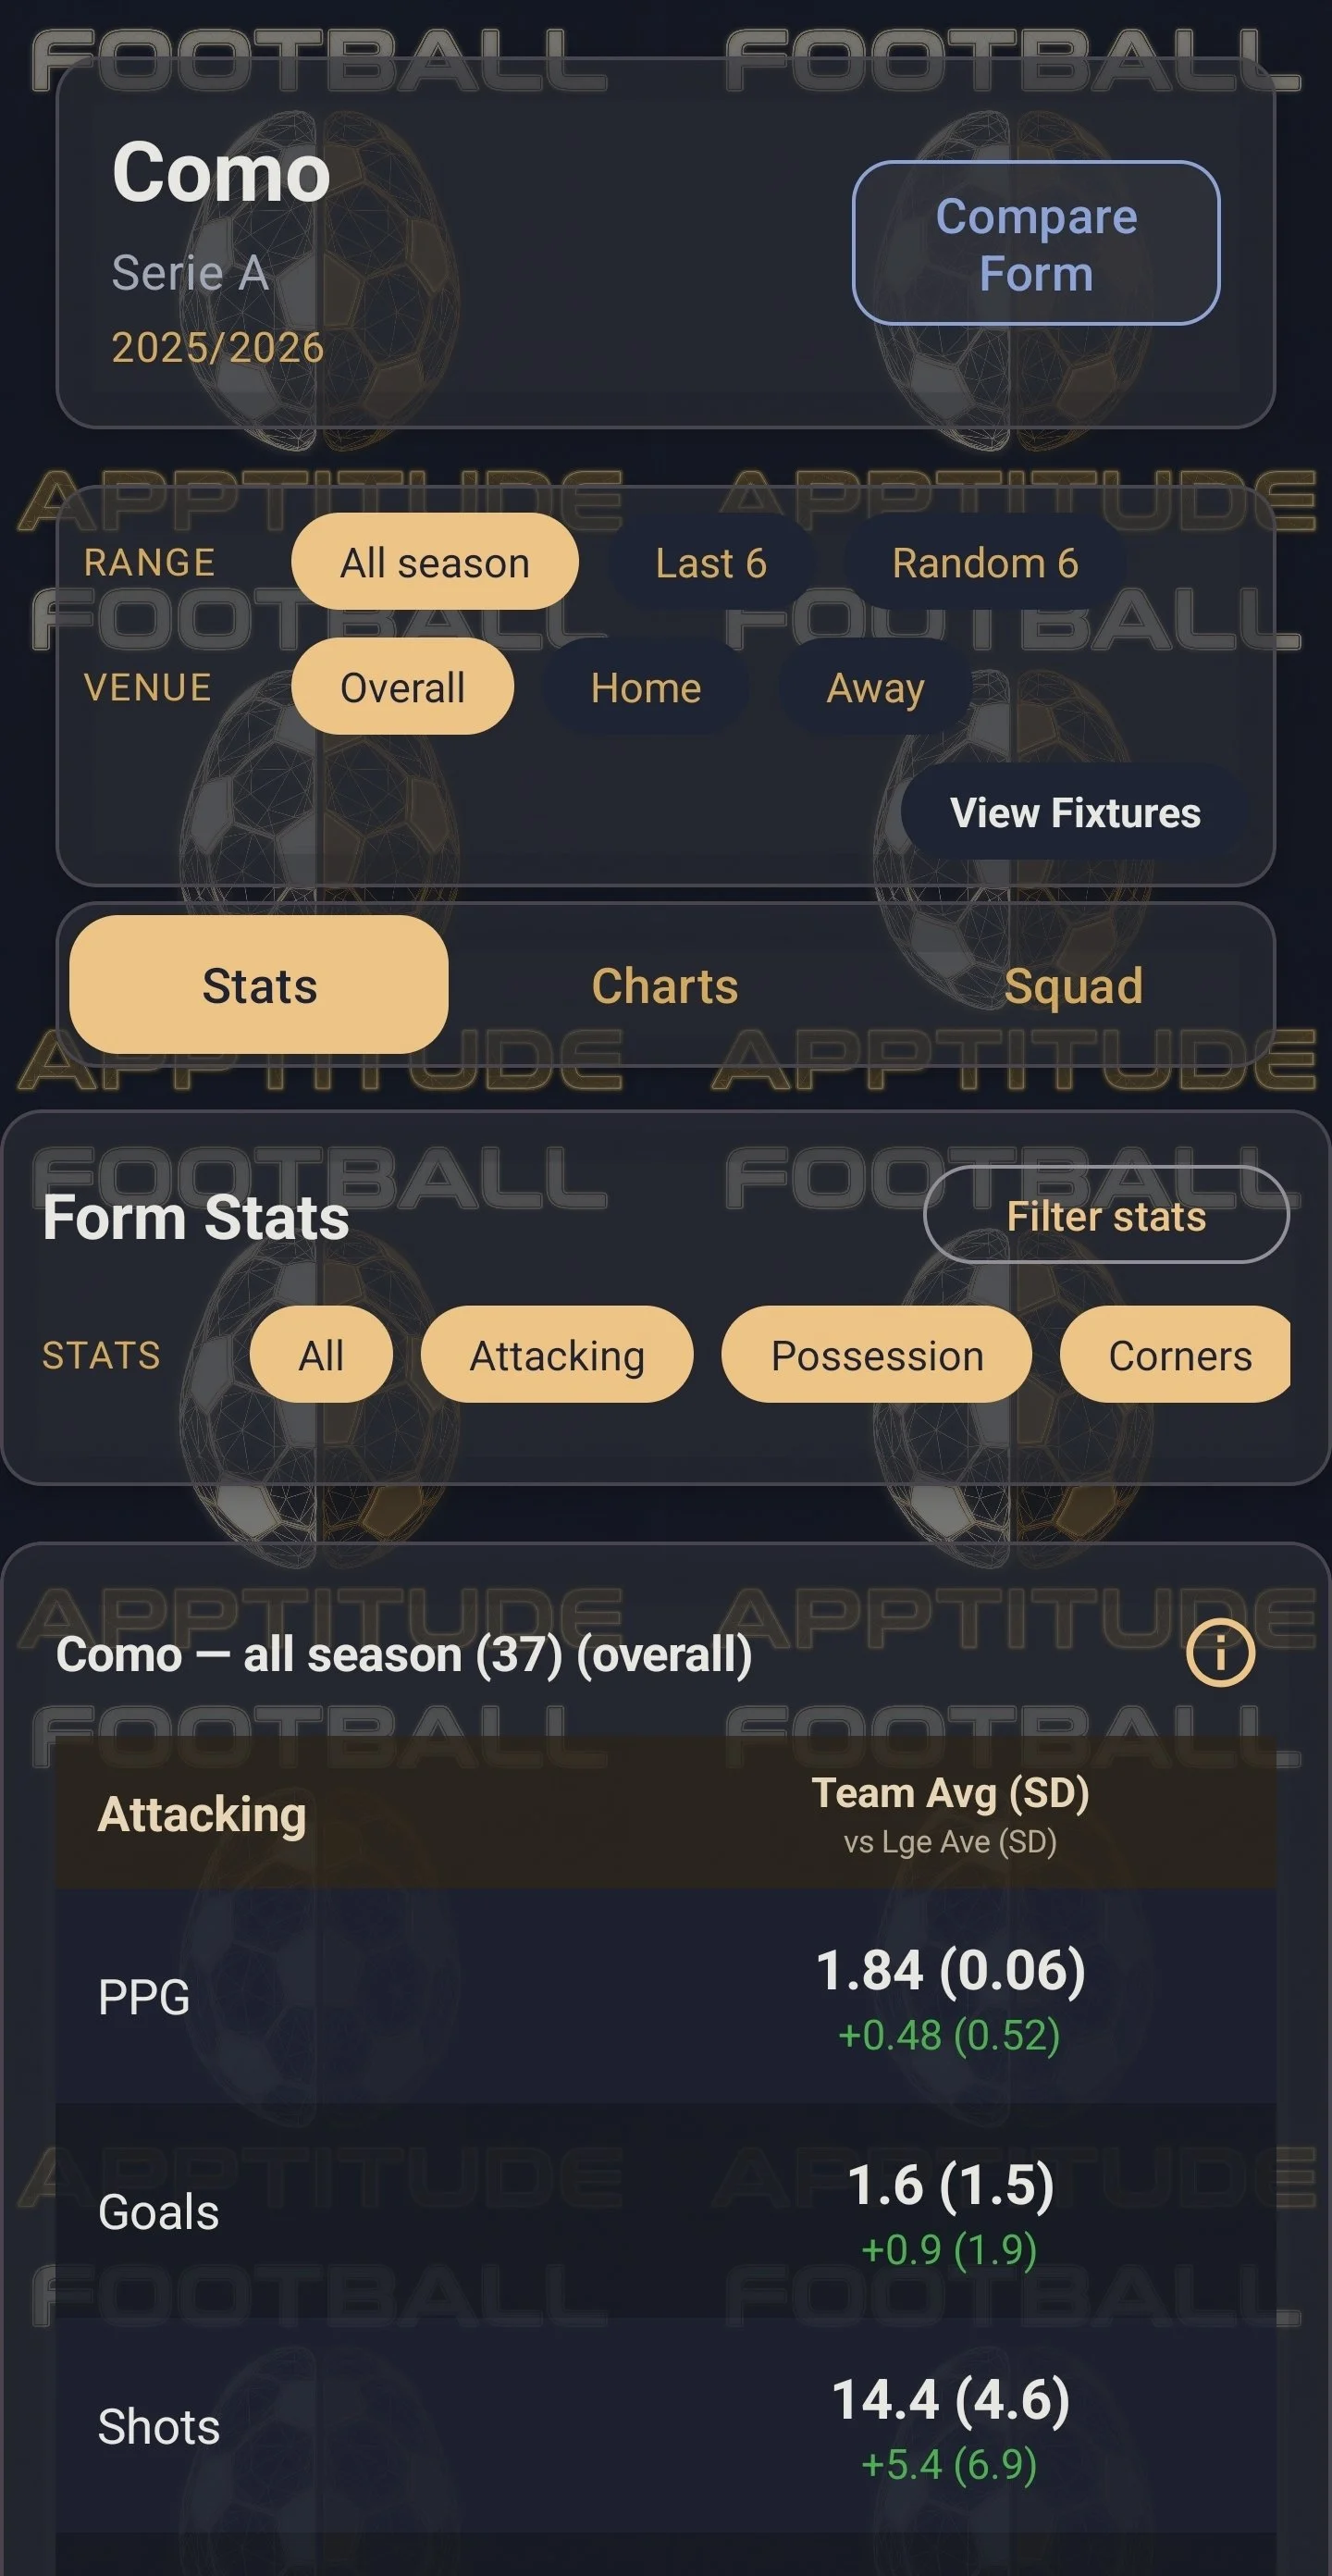
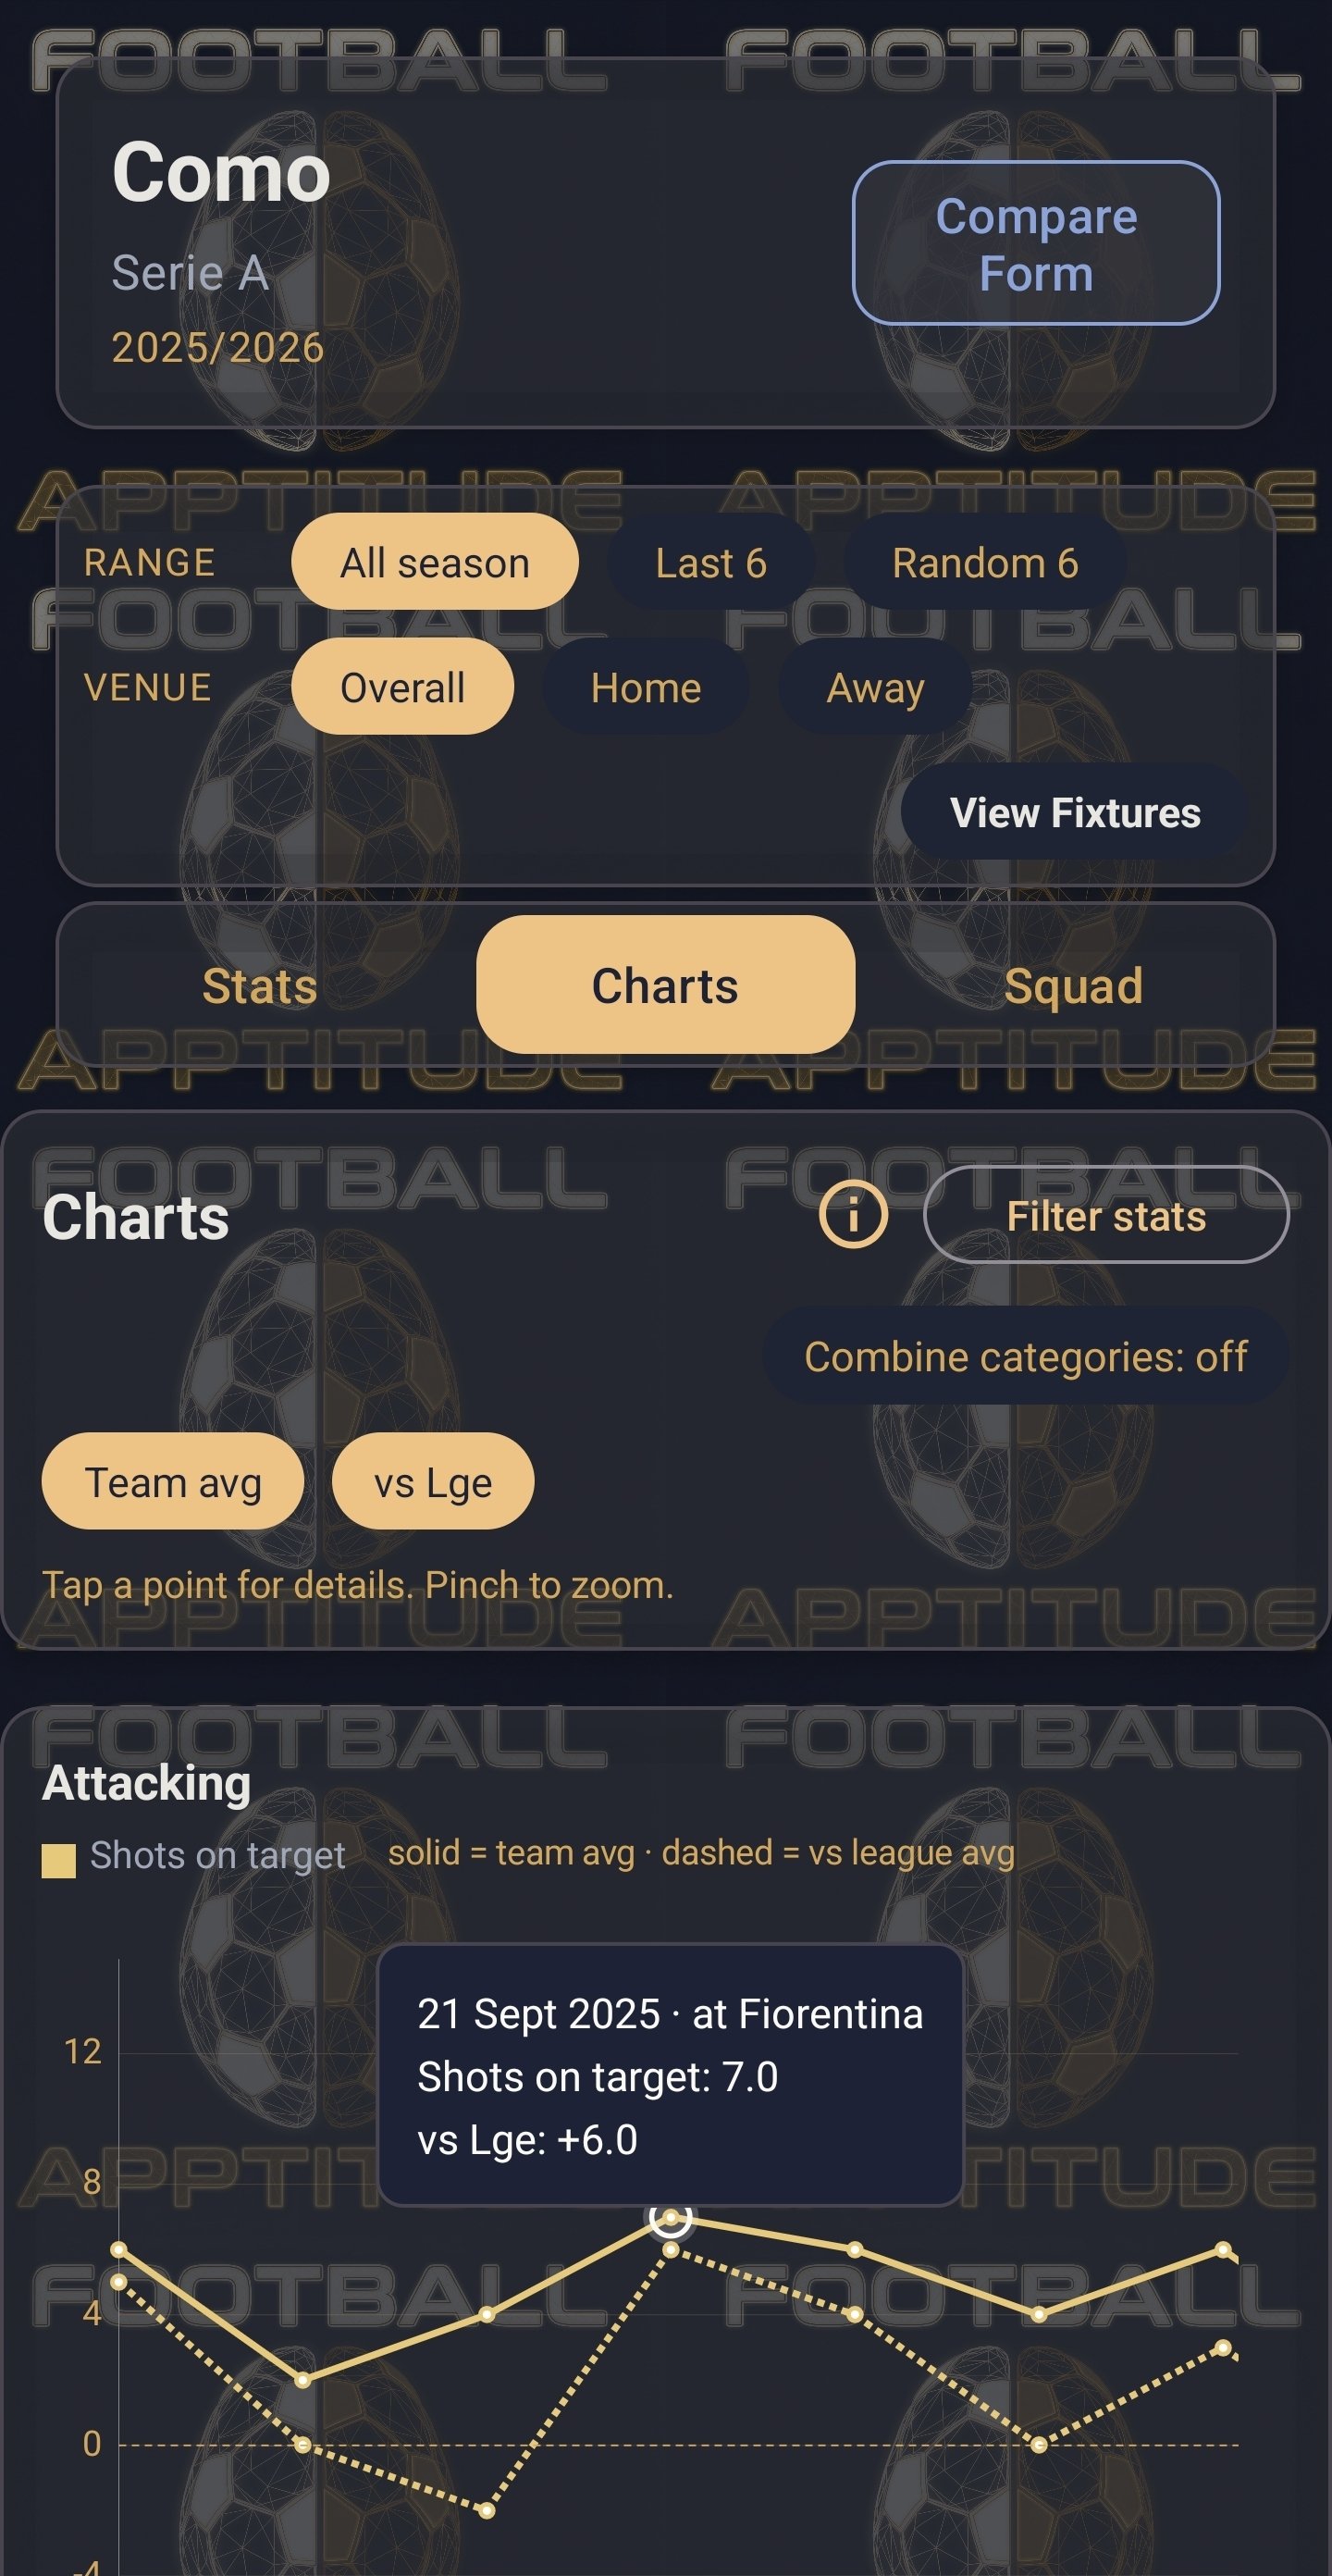
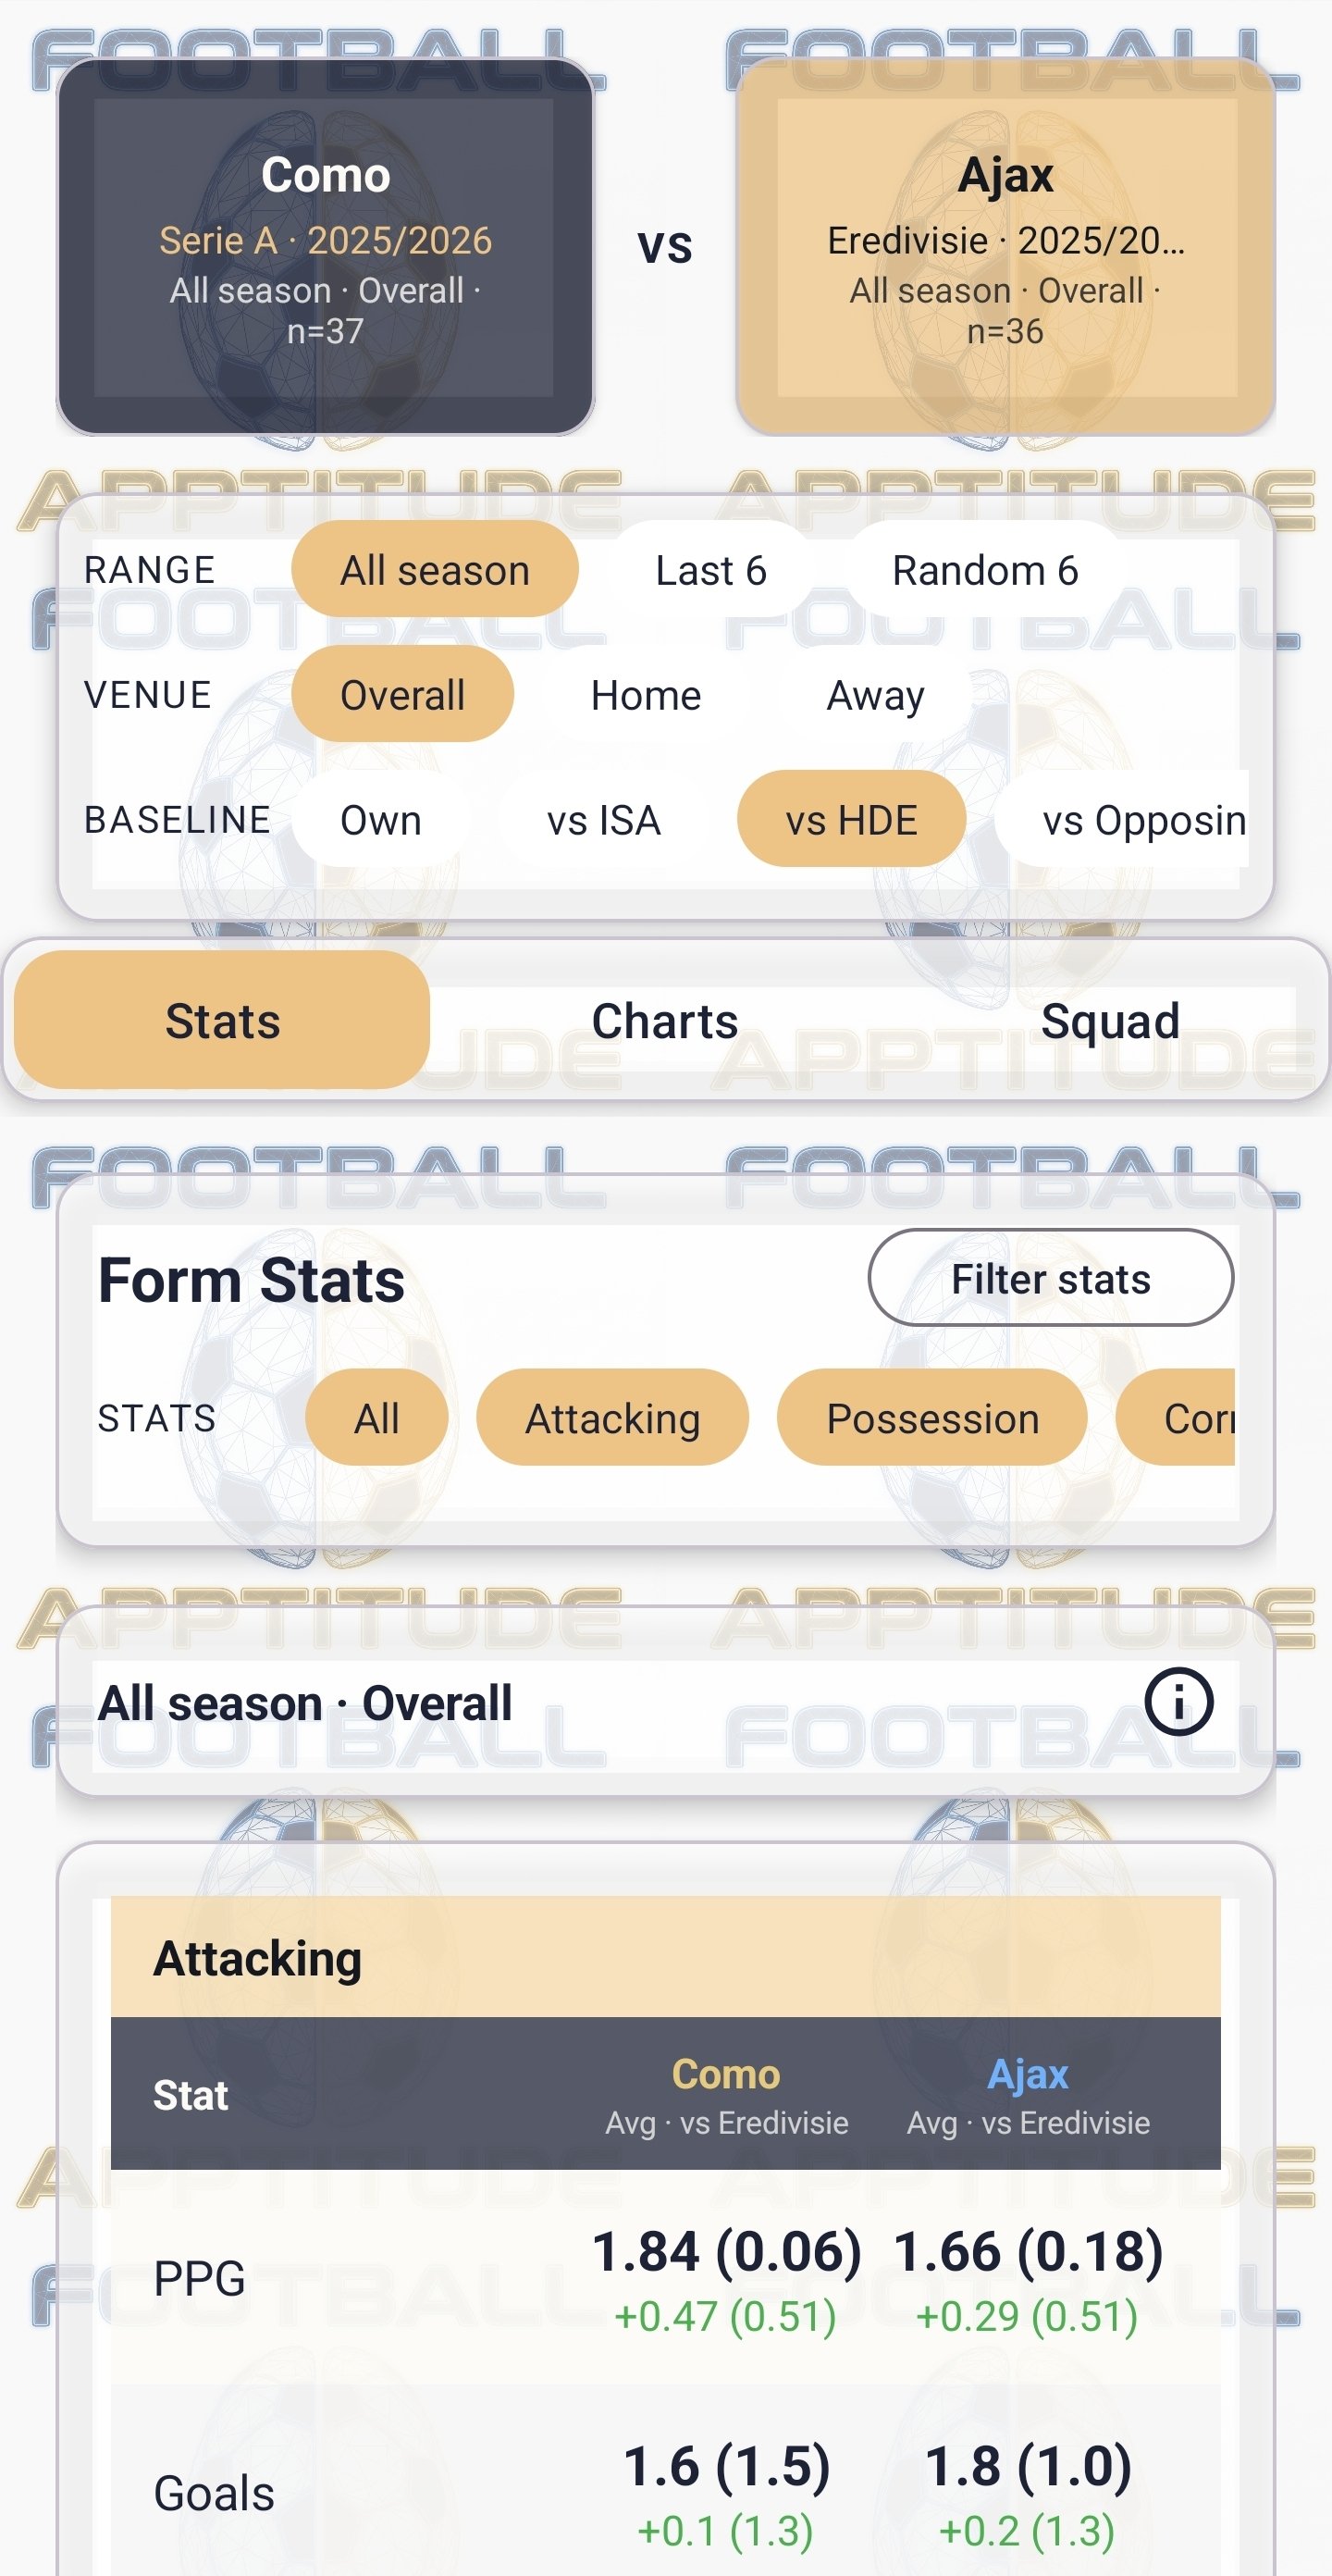
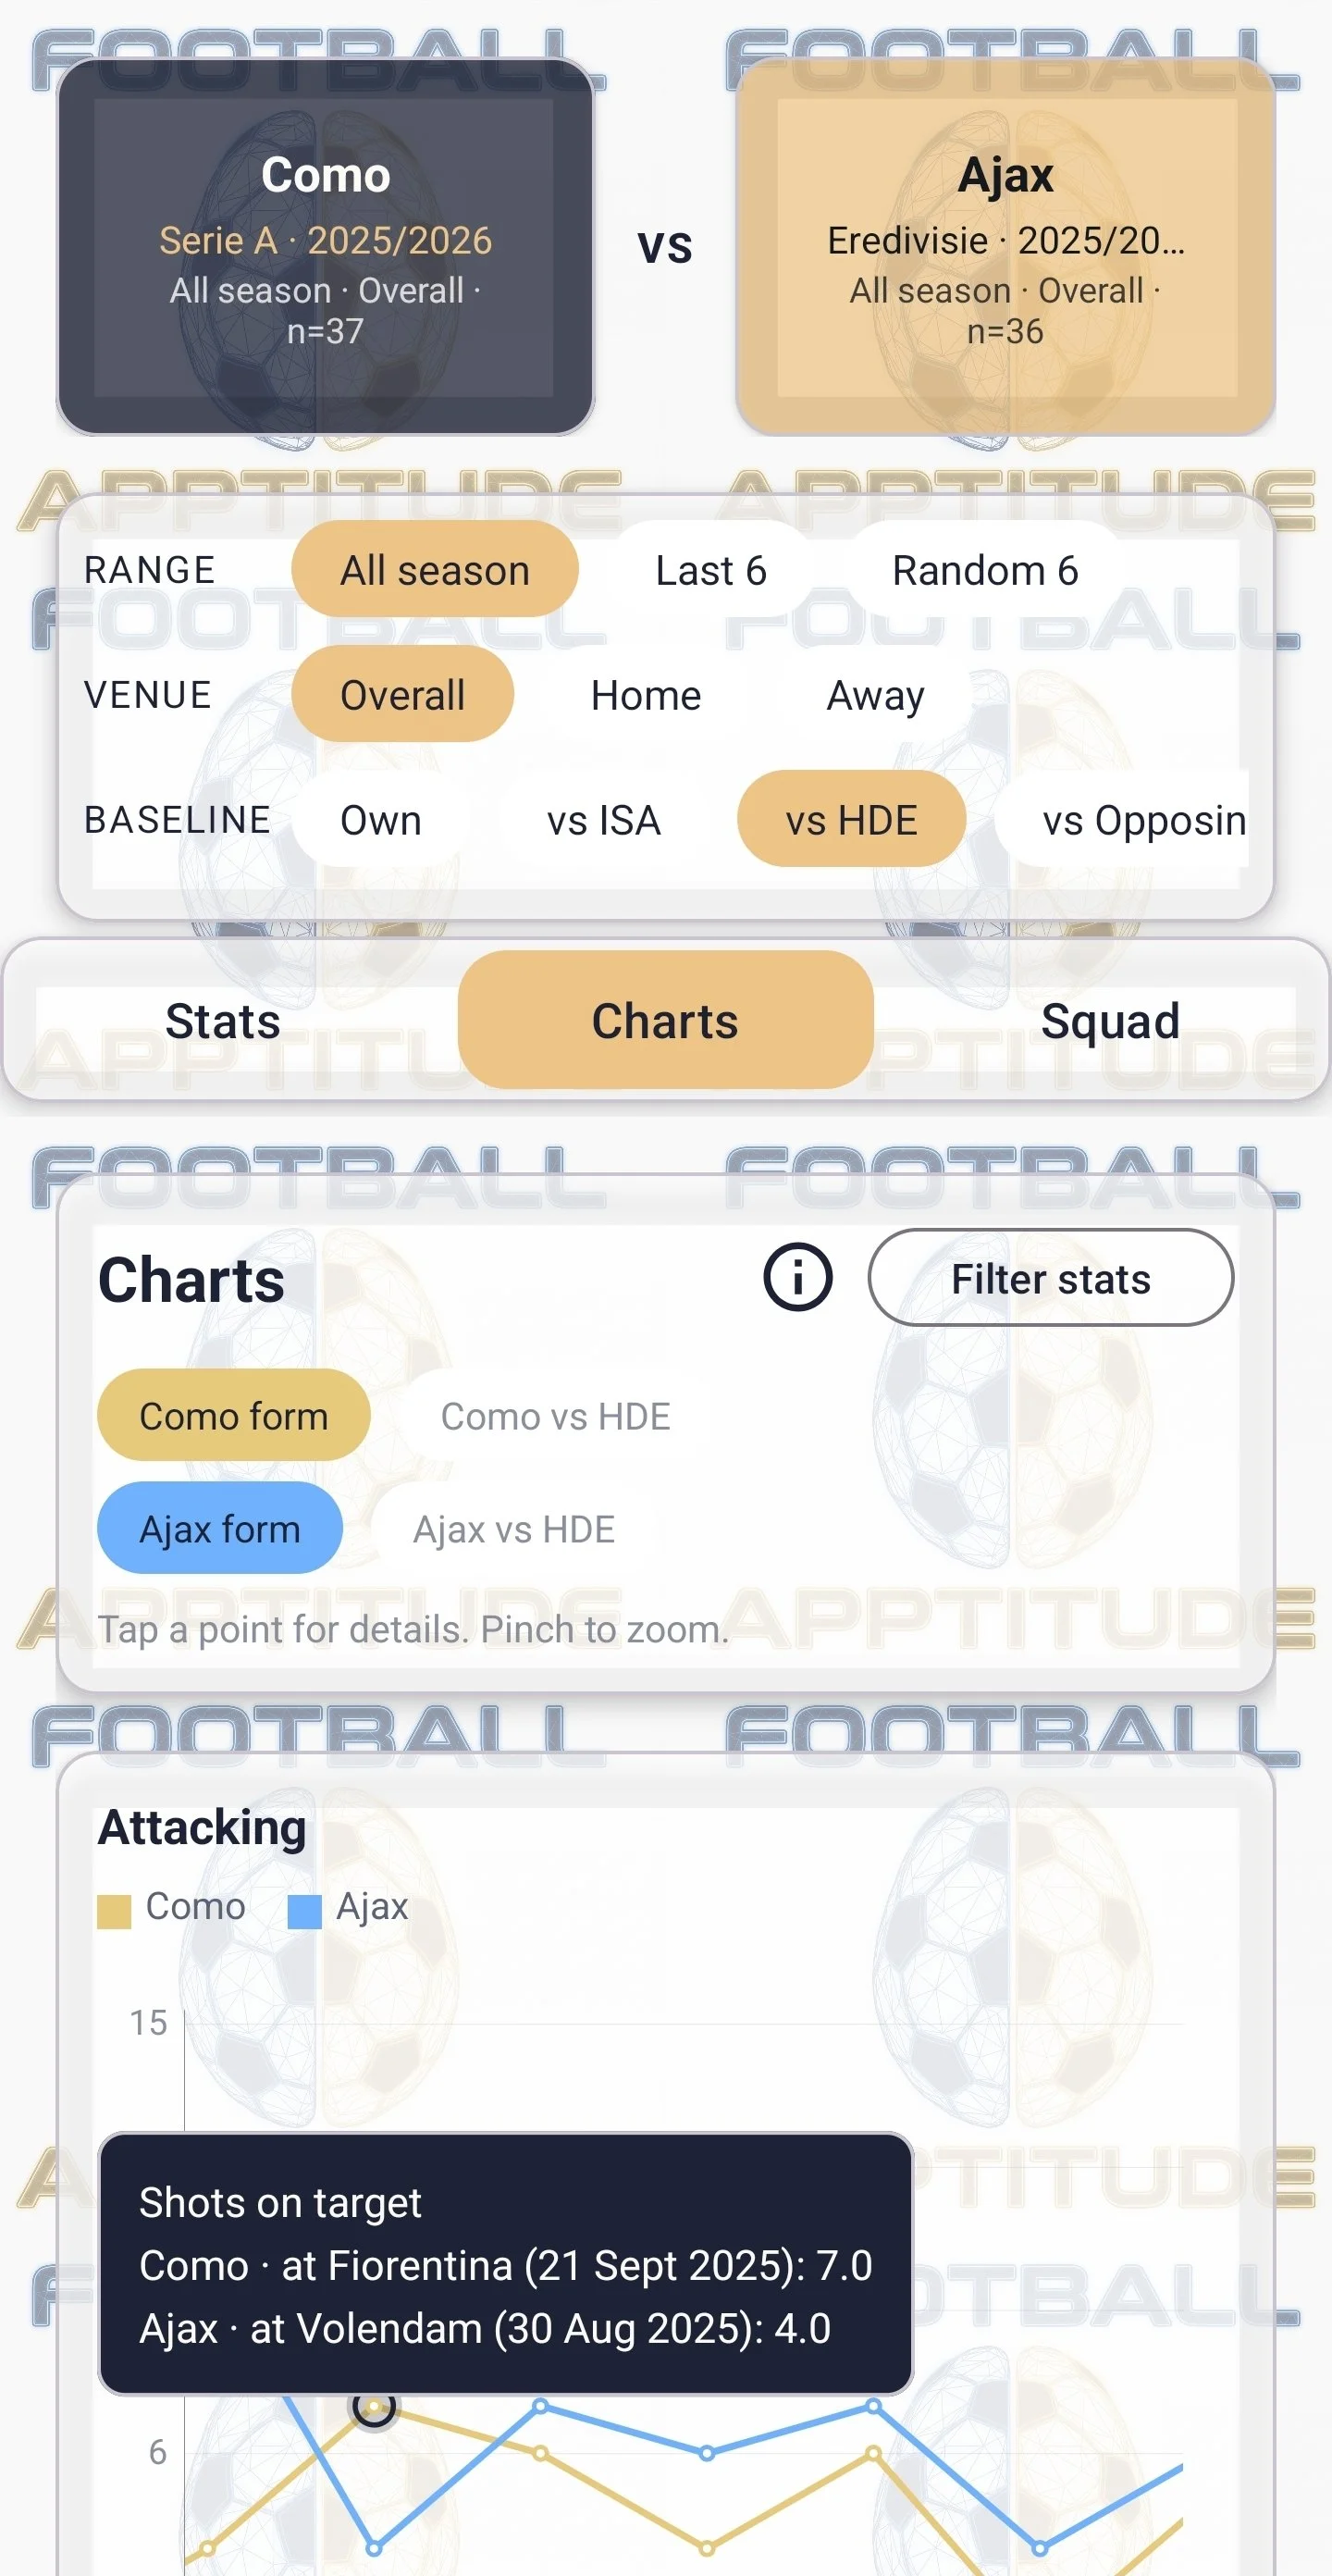
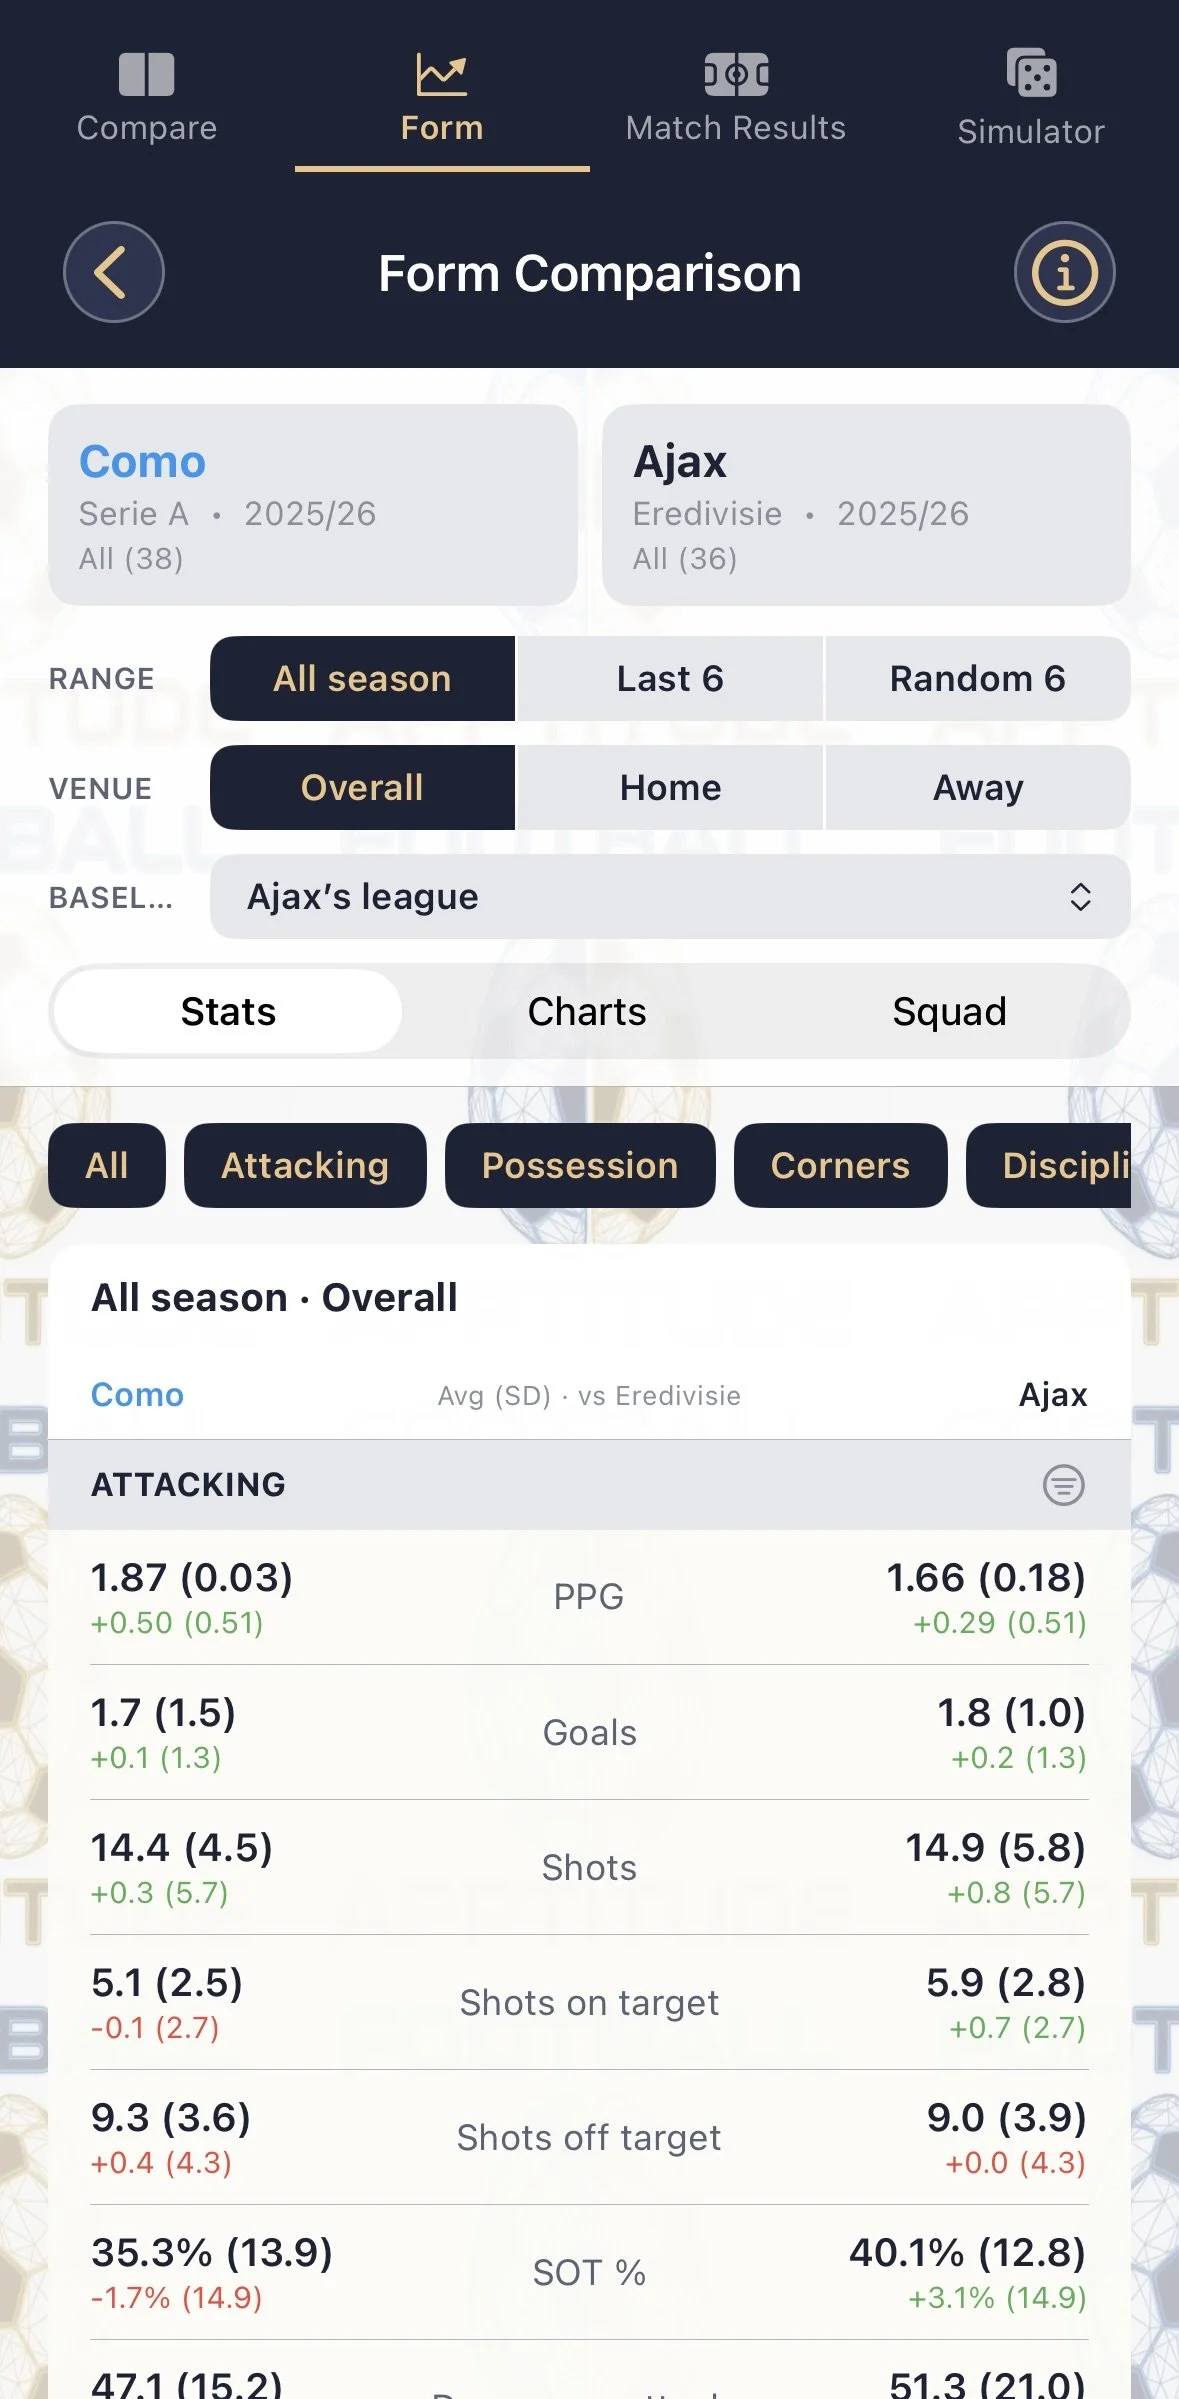
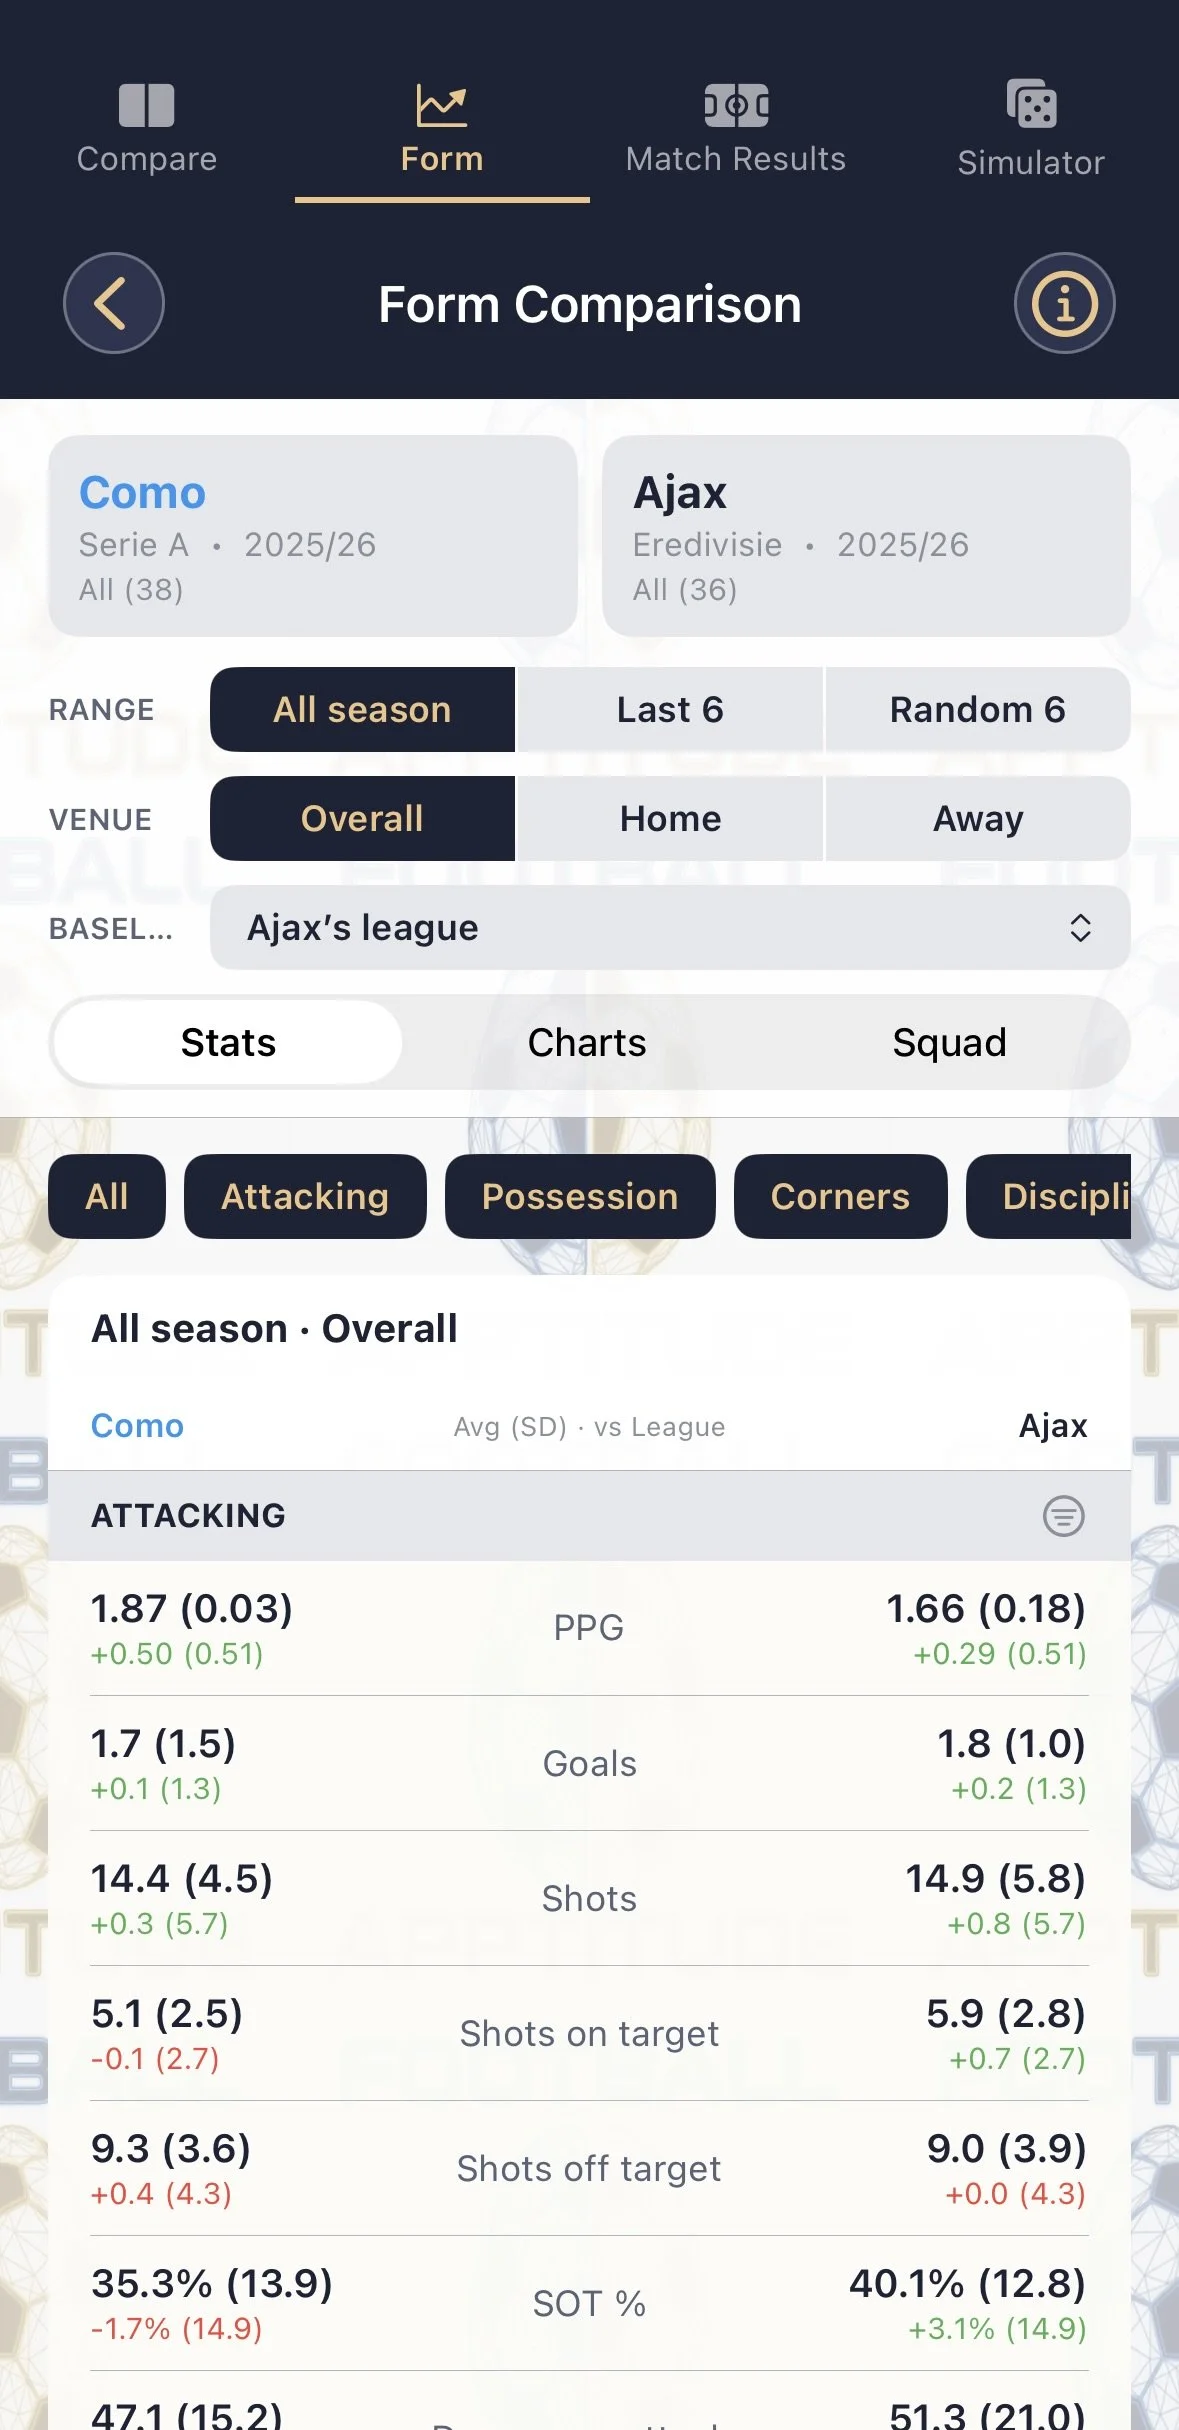
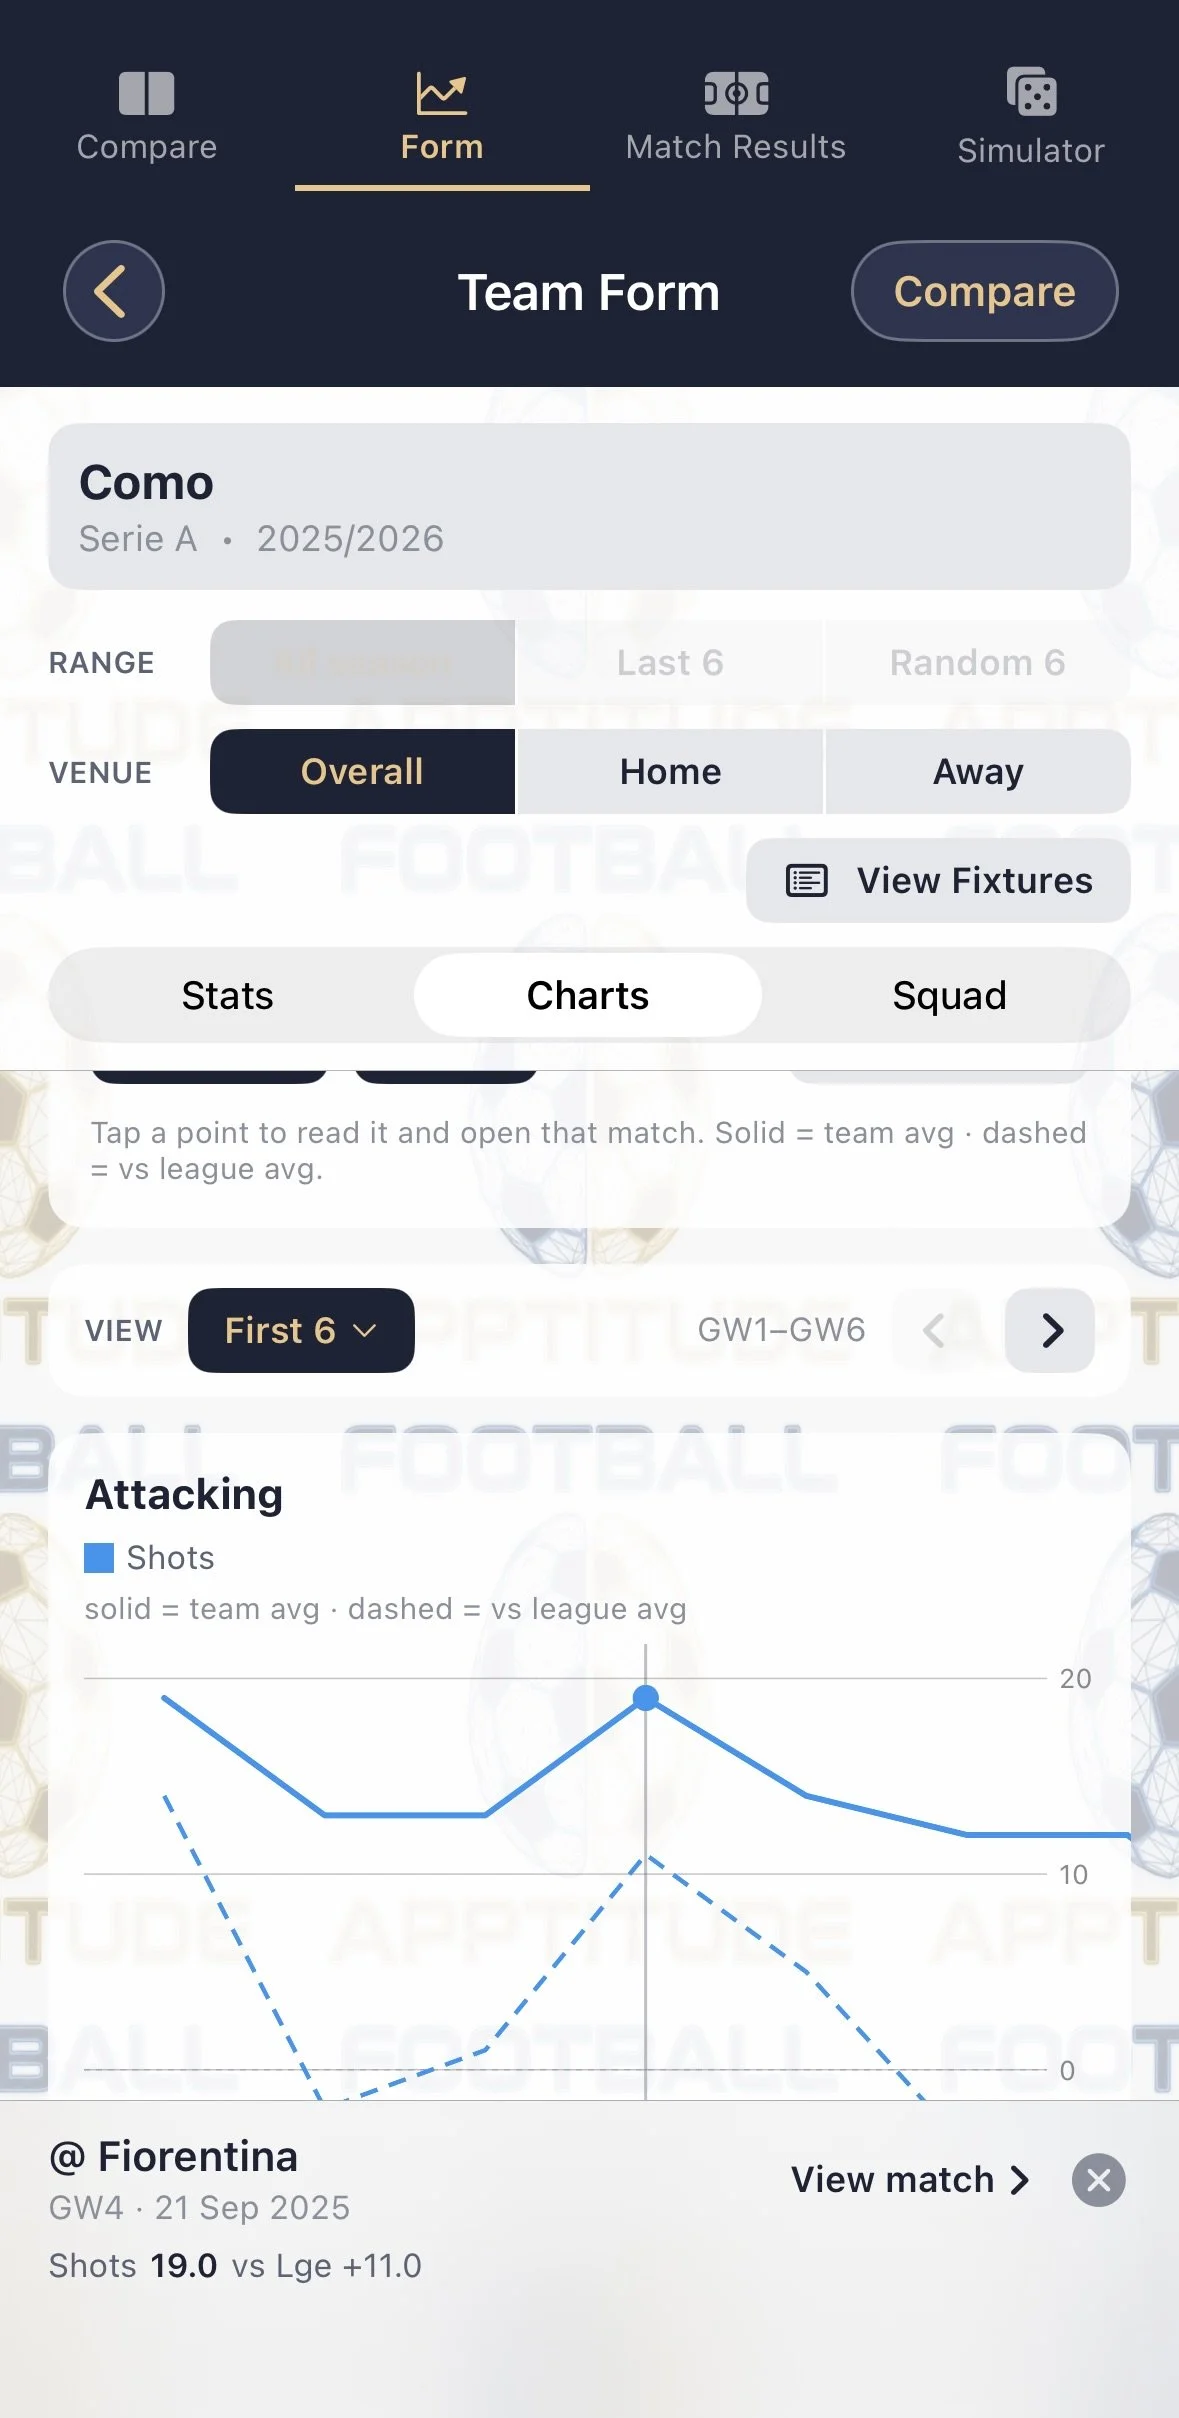
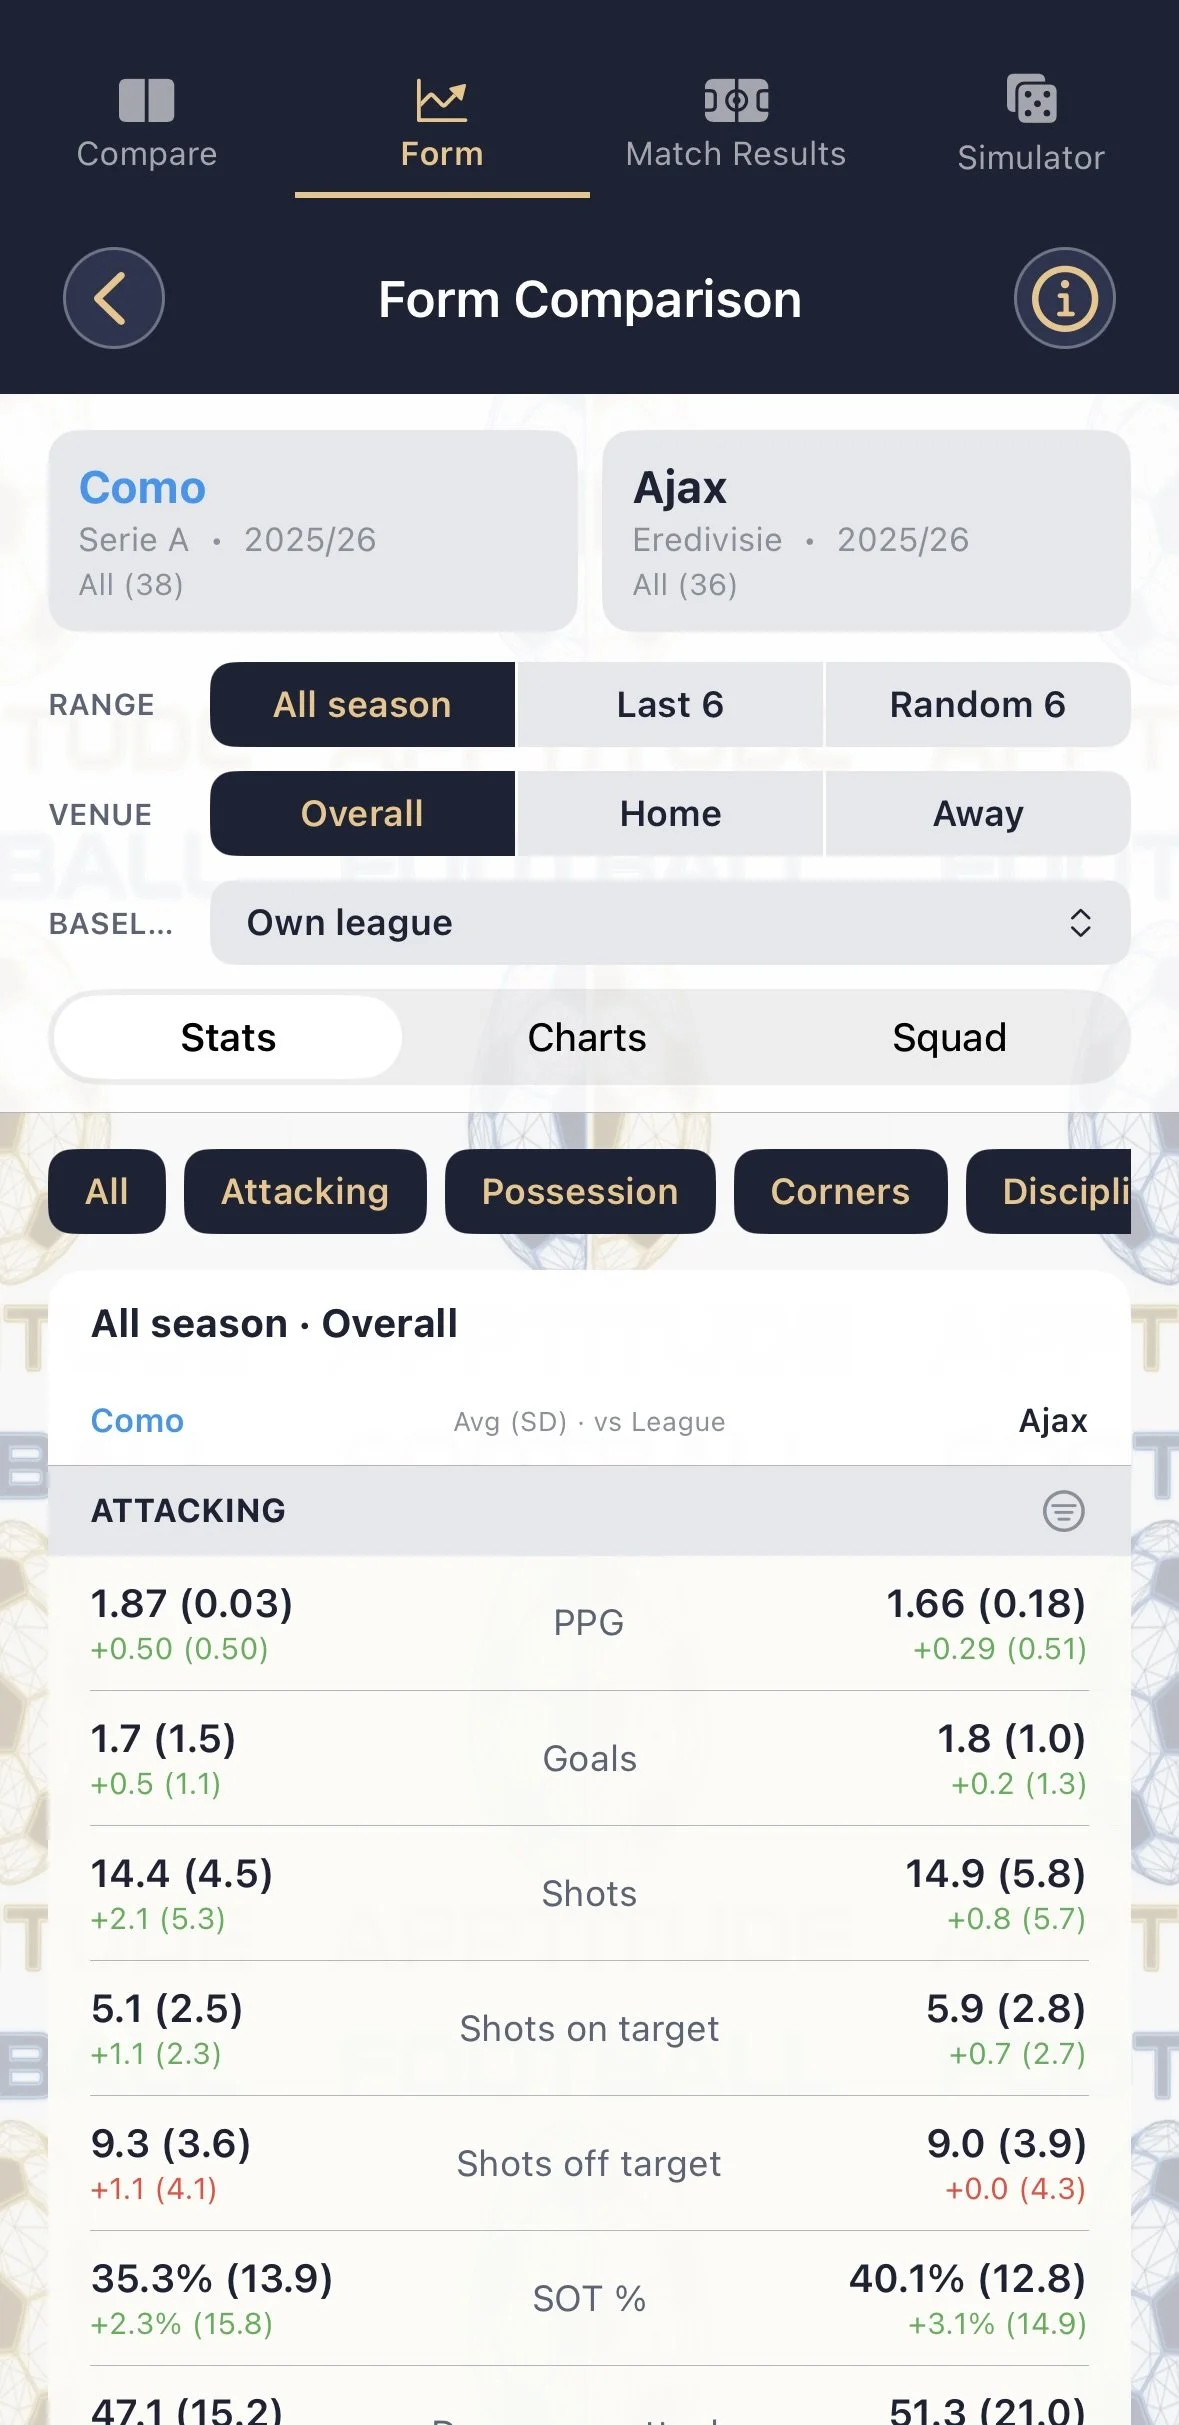
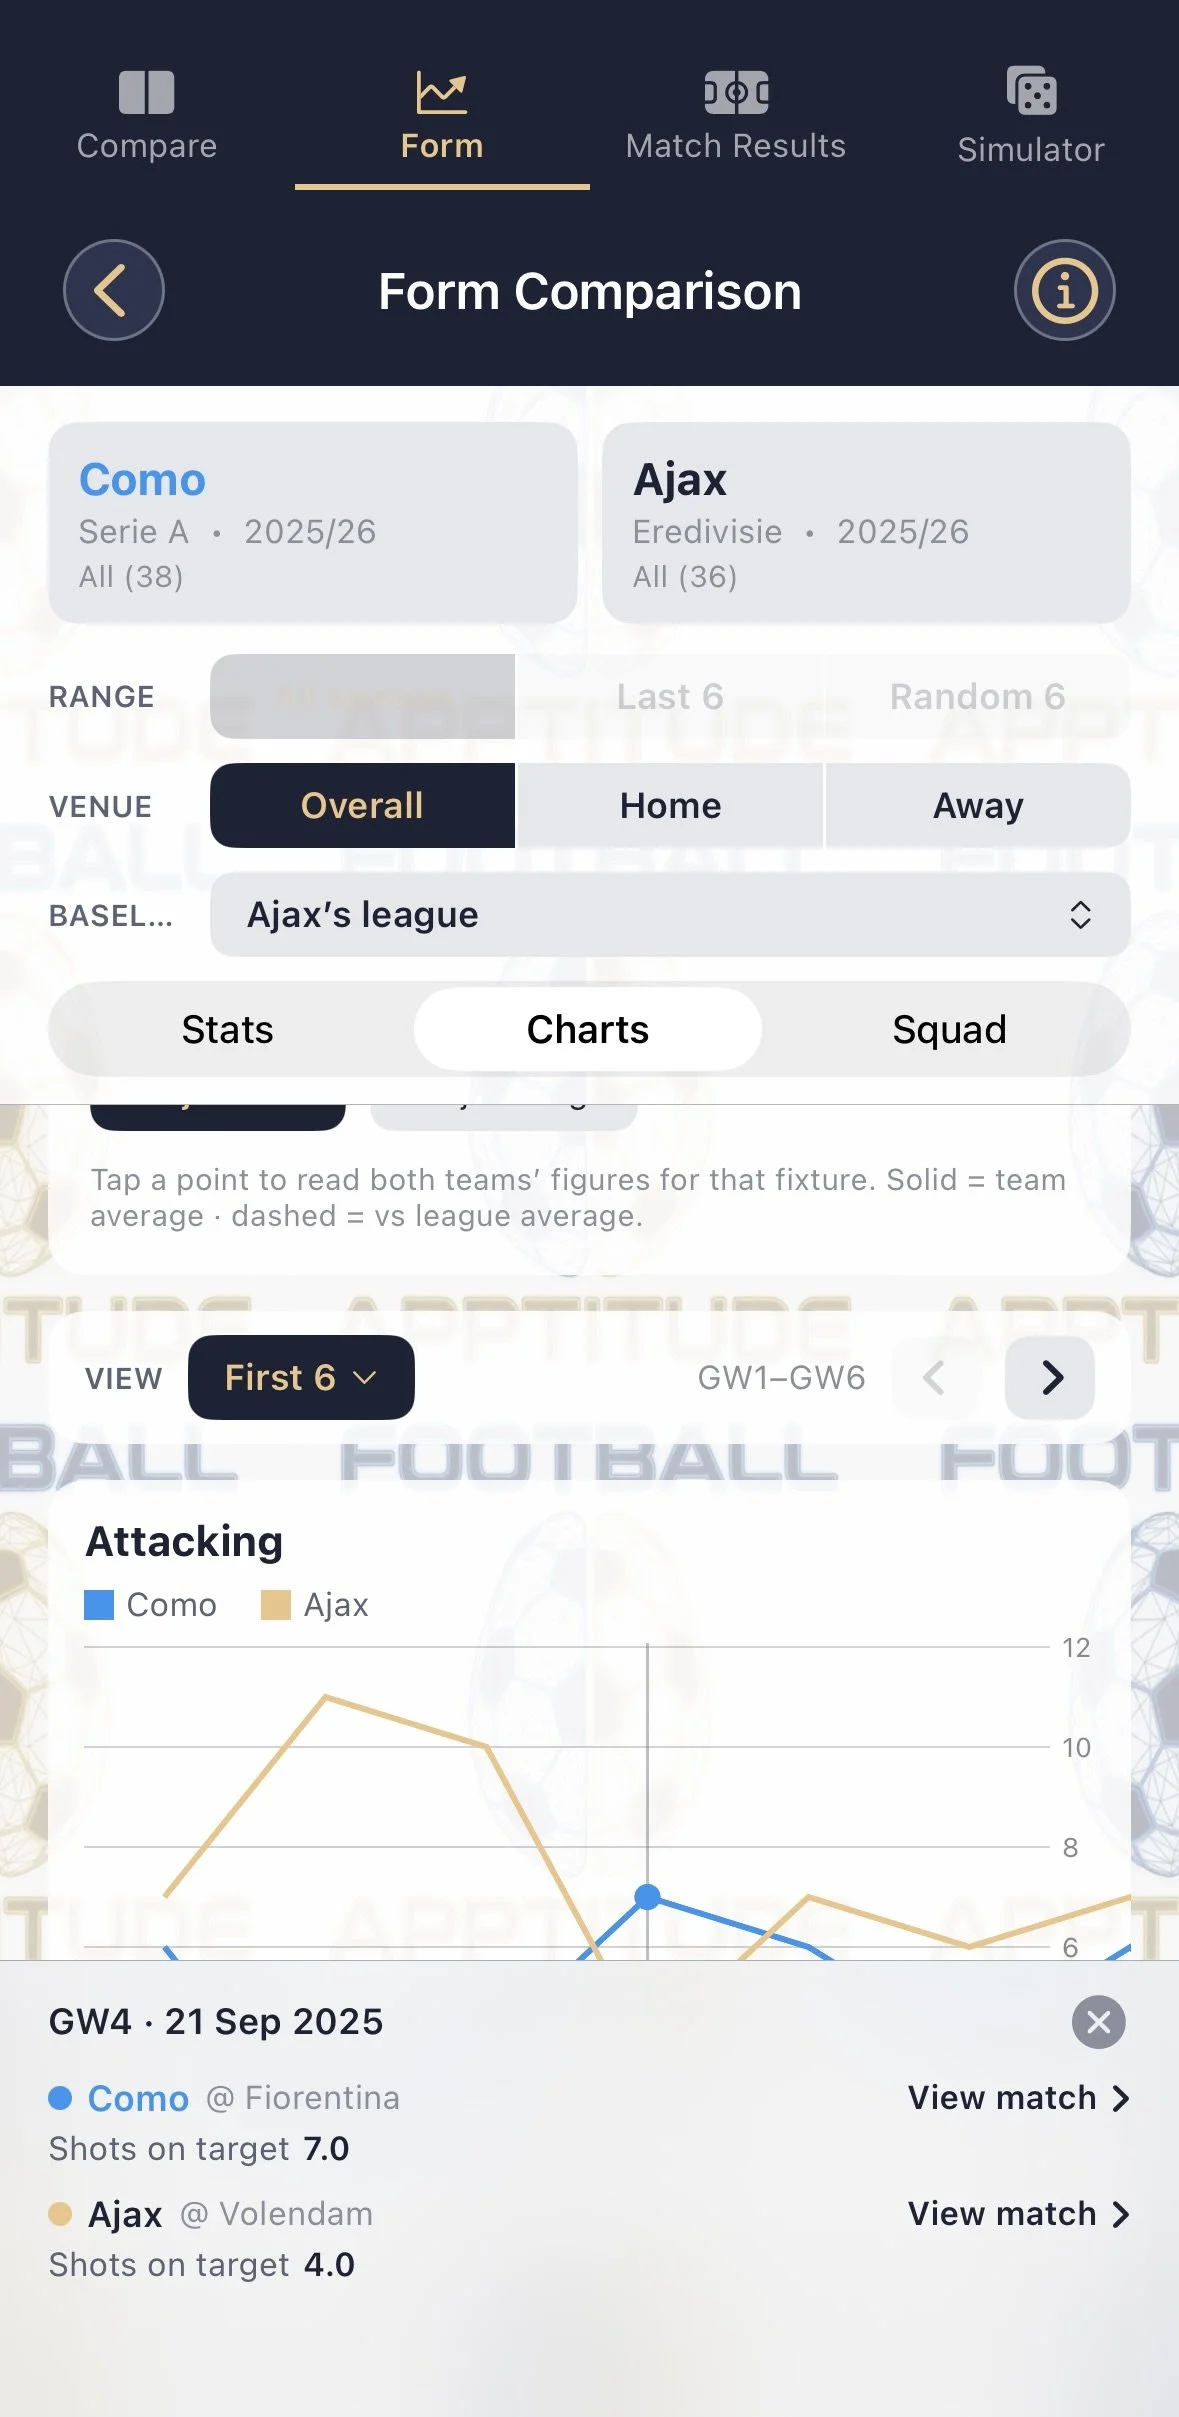
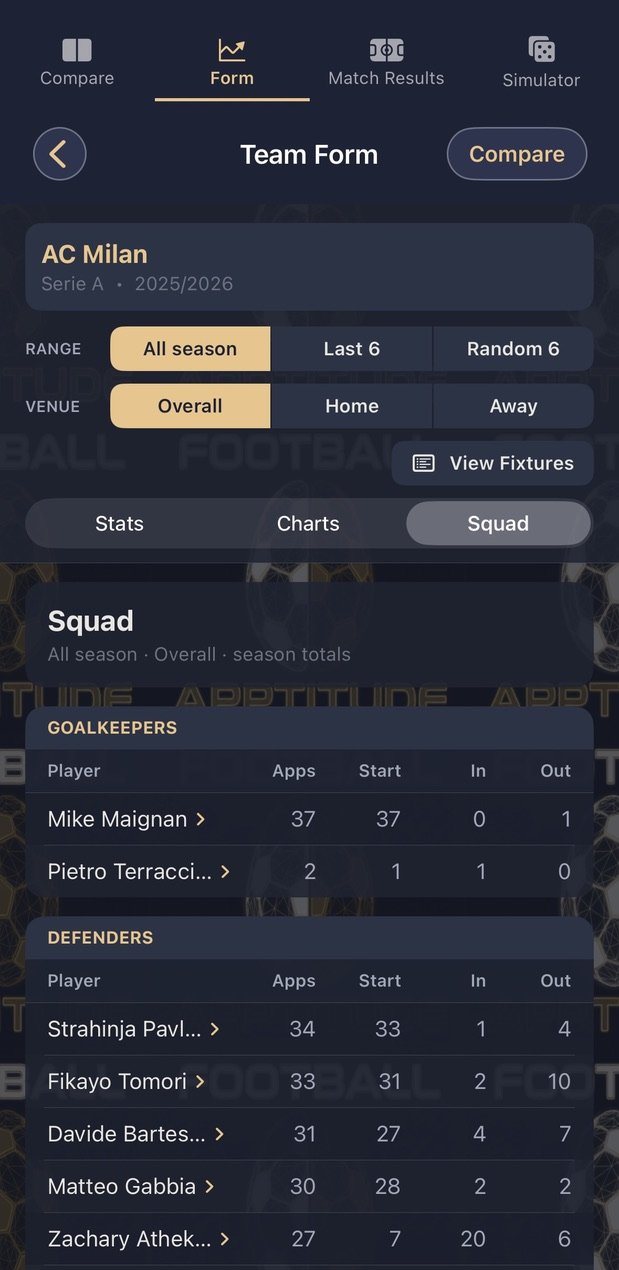
Detailed form statistics and charts along with squad statistics for the chosen season.
Filter across a range of fixtures or isolate for Home / Away form.
Stats show total values, team averages per game, and comparison to the league standard.
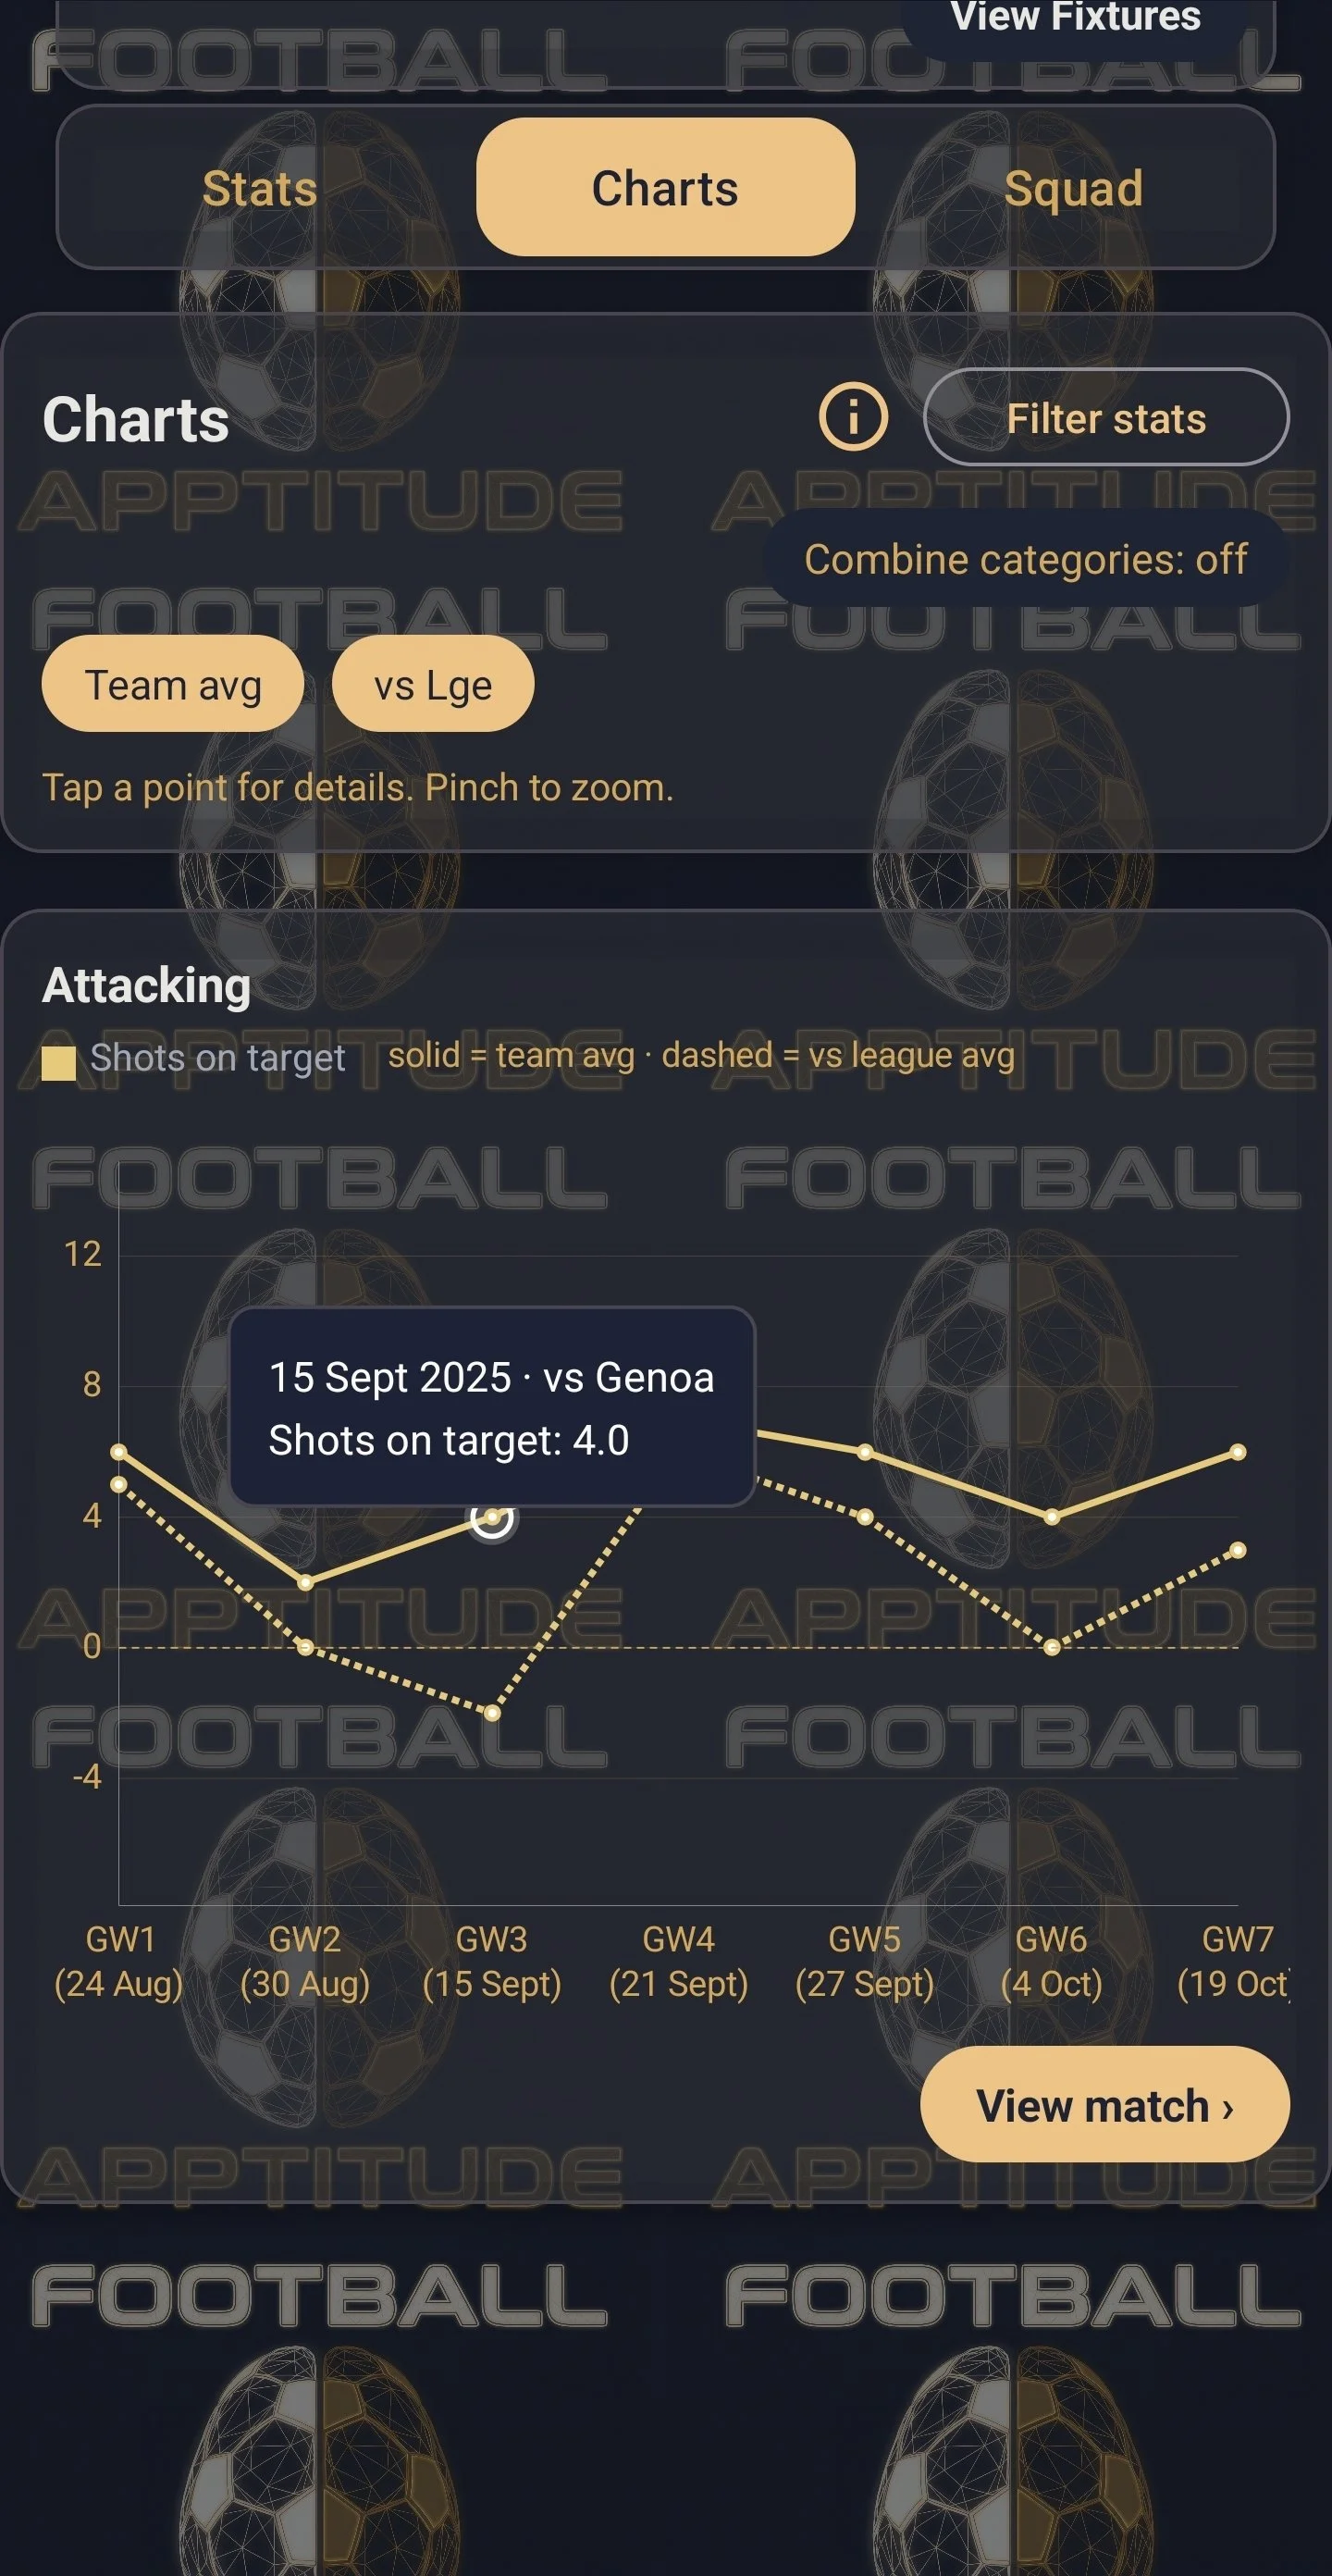
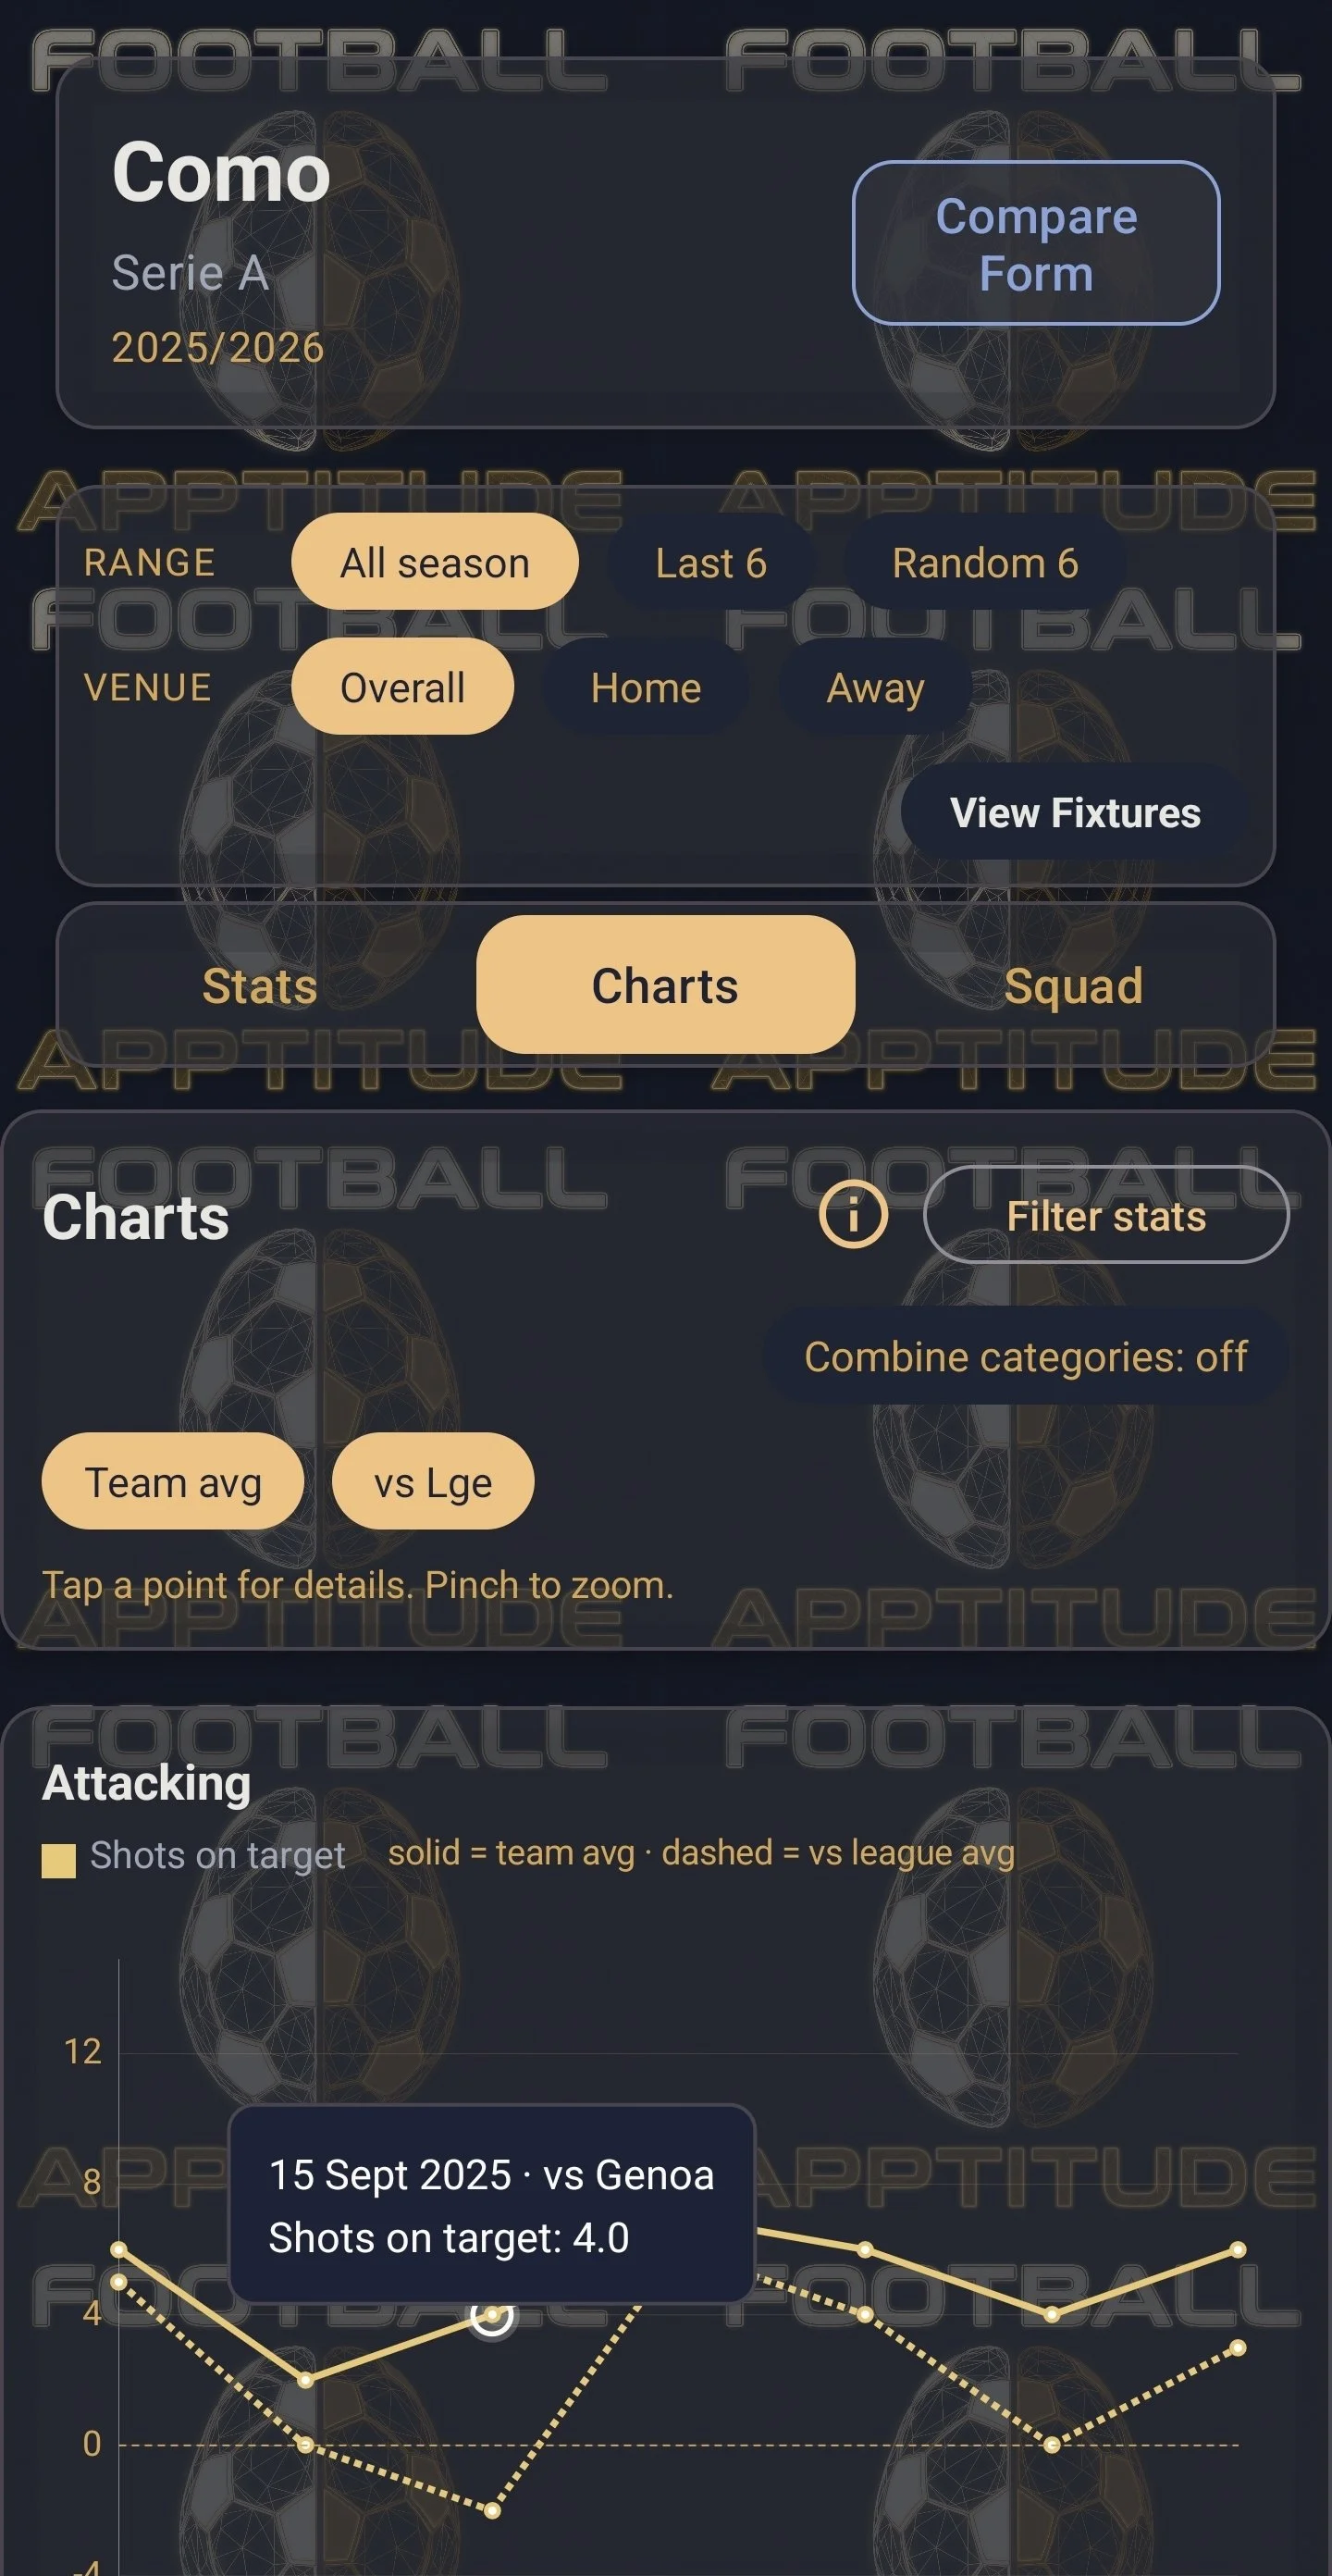
Interactable charts show progress by match over the course of the season and show spikes in the values per fixture.
Baseline comparison for the league can be added.
All views are customisable. Stats can be combined into one chart or separated by category (e.g.: Attack / Defence).
-
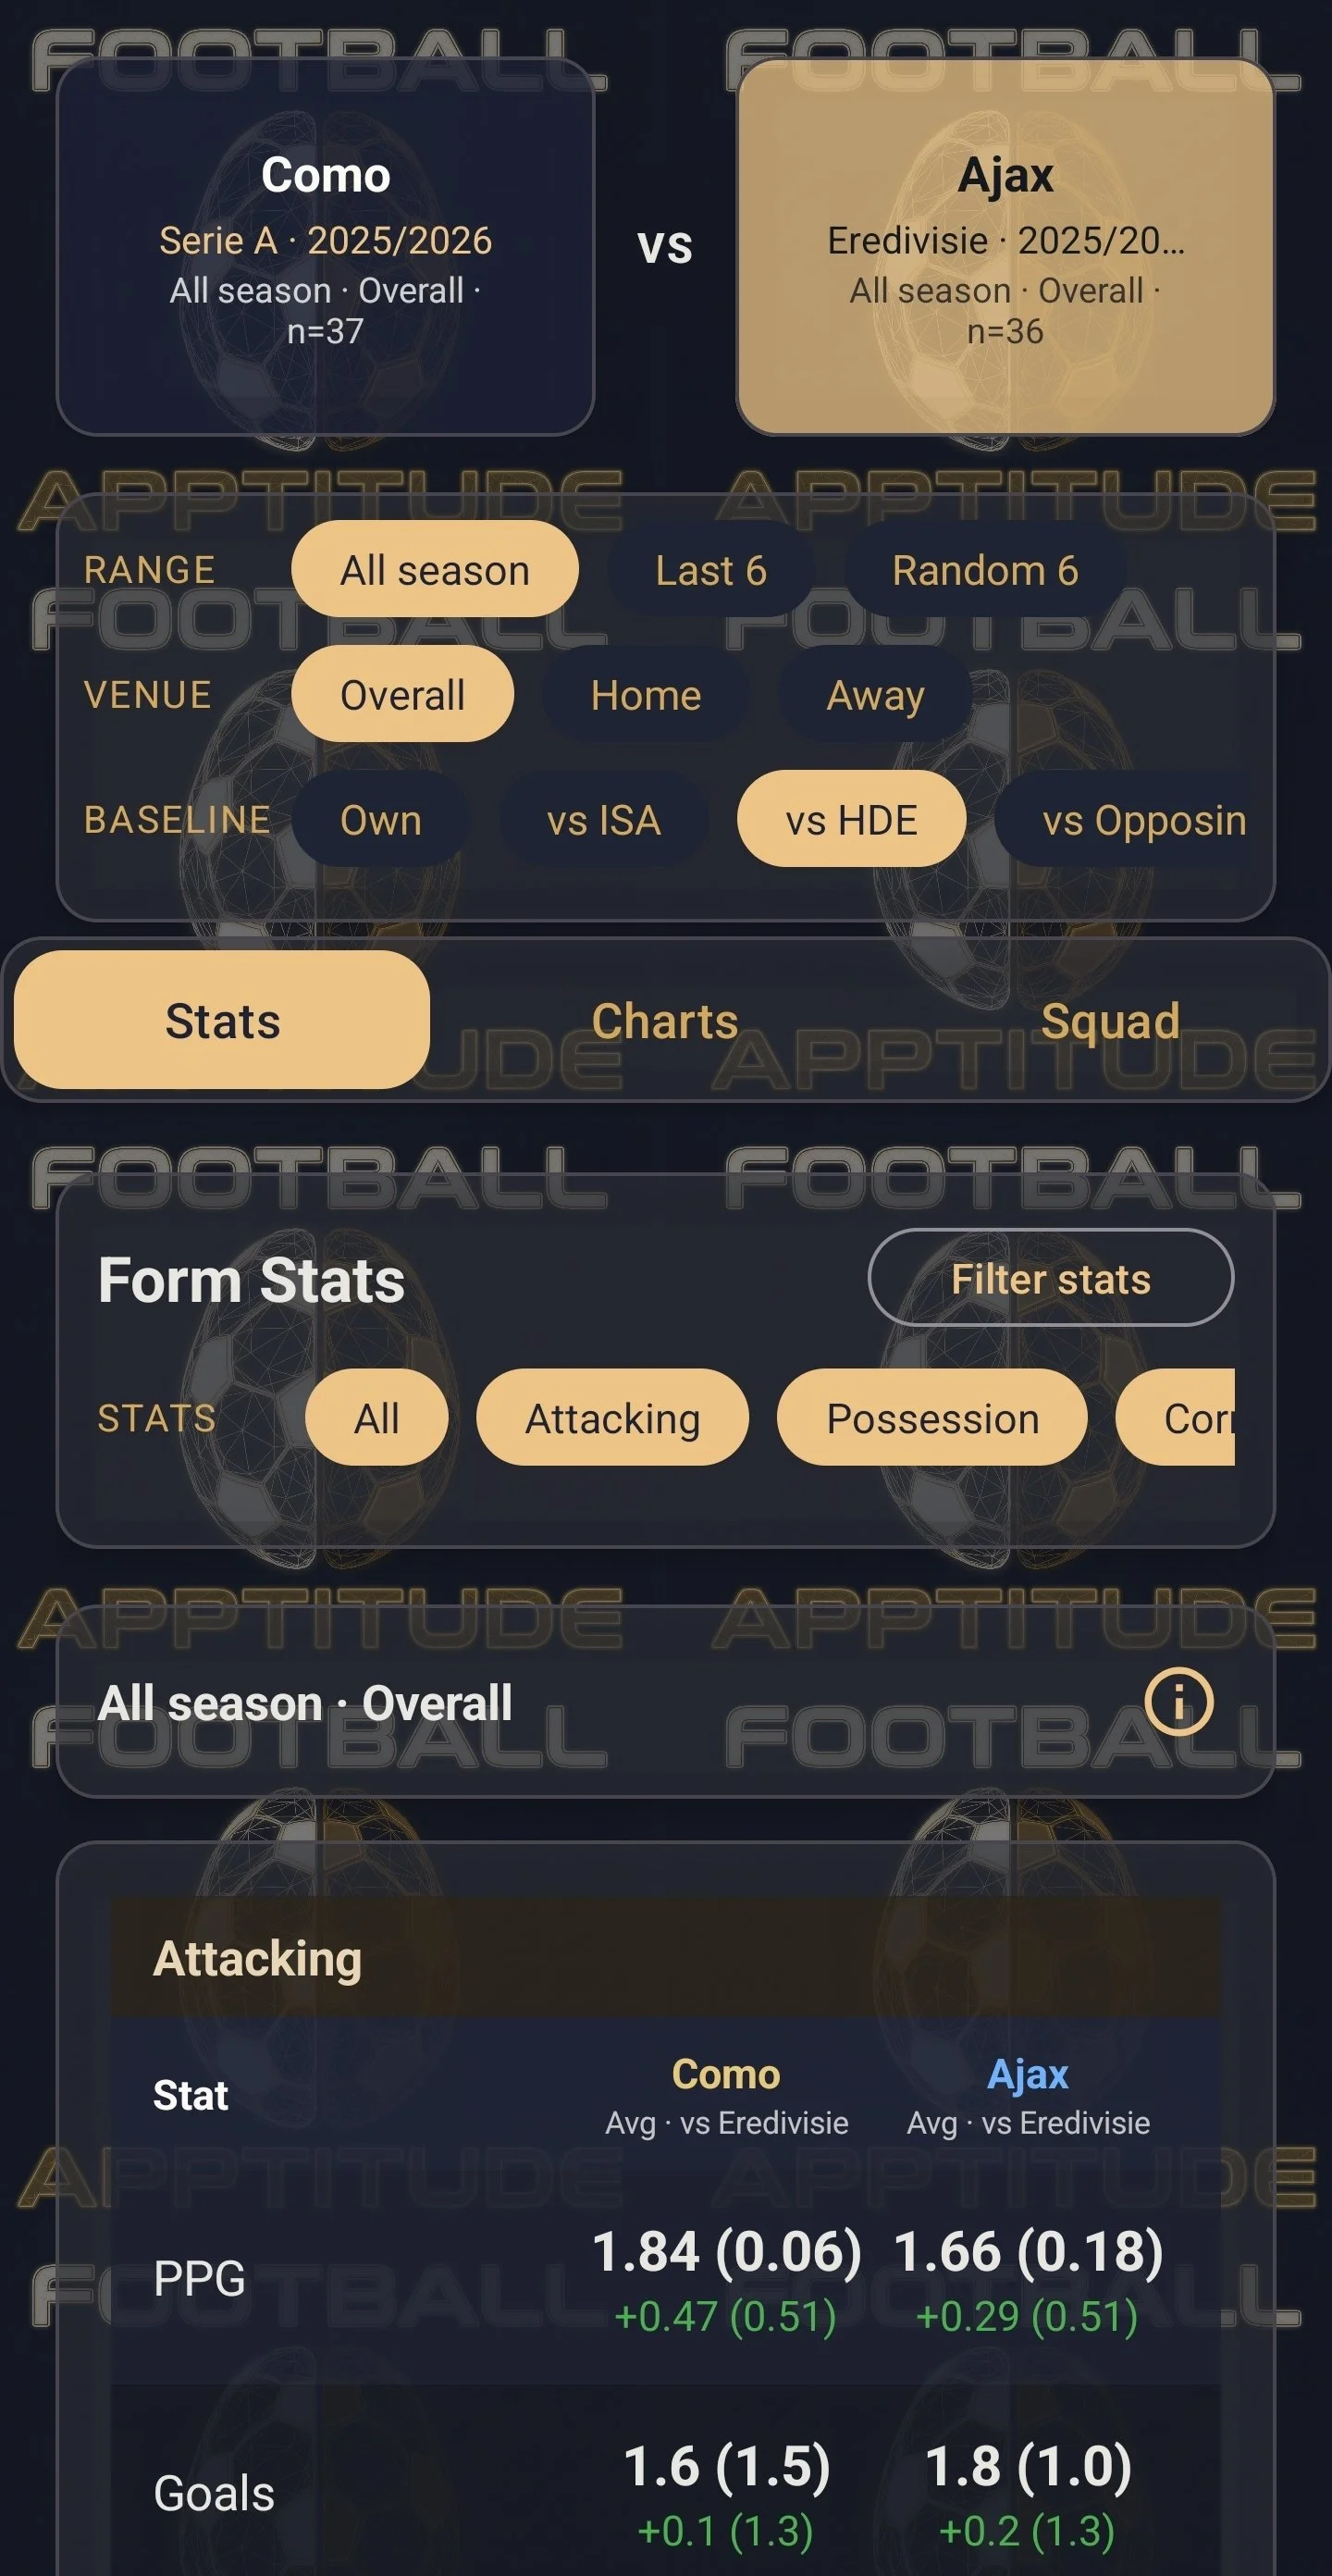
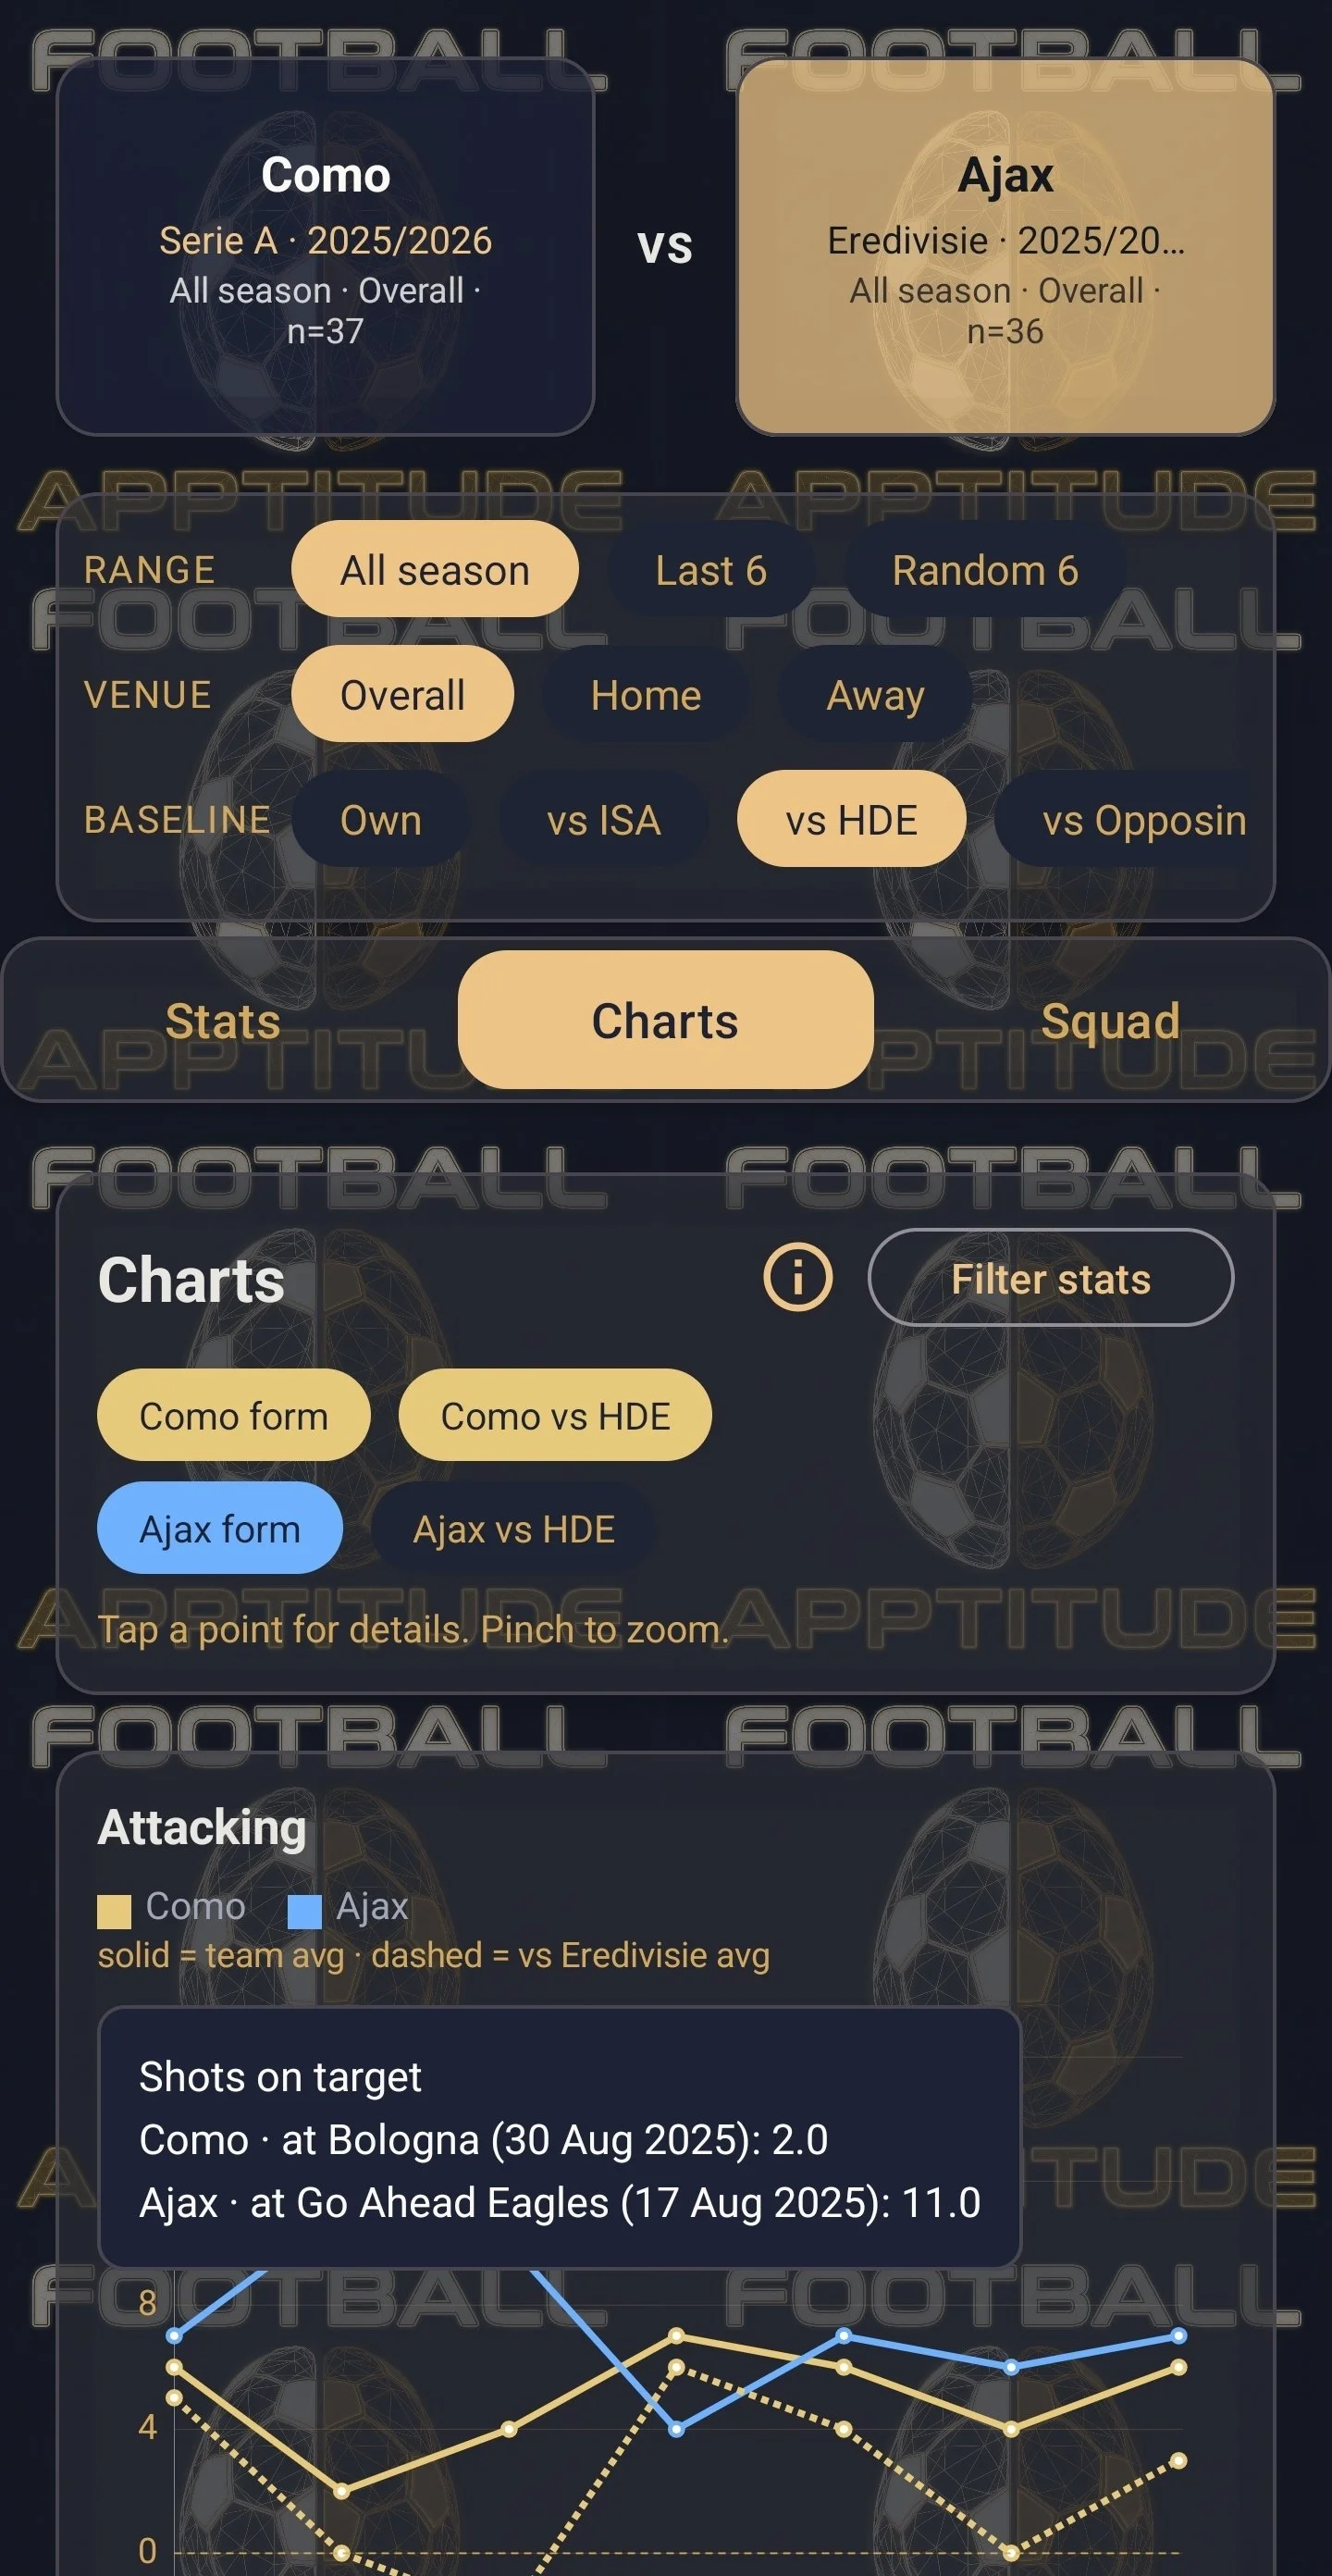
Use the form data for a team and then compare them to the form of another team.
Comparisons can be done across both Leagues and Seasons.
Comparison data can be customised across the baselines for either team.
Test questions like: “How does Arsenal’s form from 2025 / 2026 really compare to they performance from the previous season when adjusted for league strength?”, or “Would the form of the La Liga leaders look better or worse if they were playing against Bundesliga opposition?”.
-
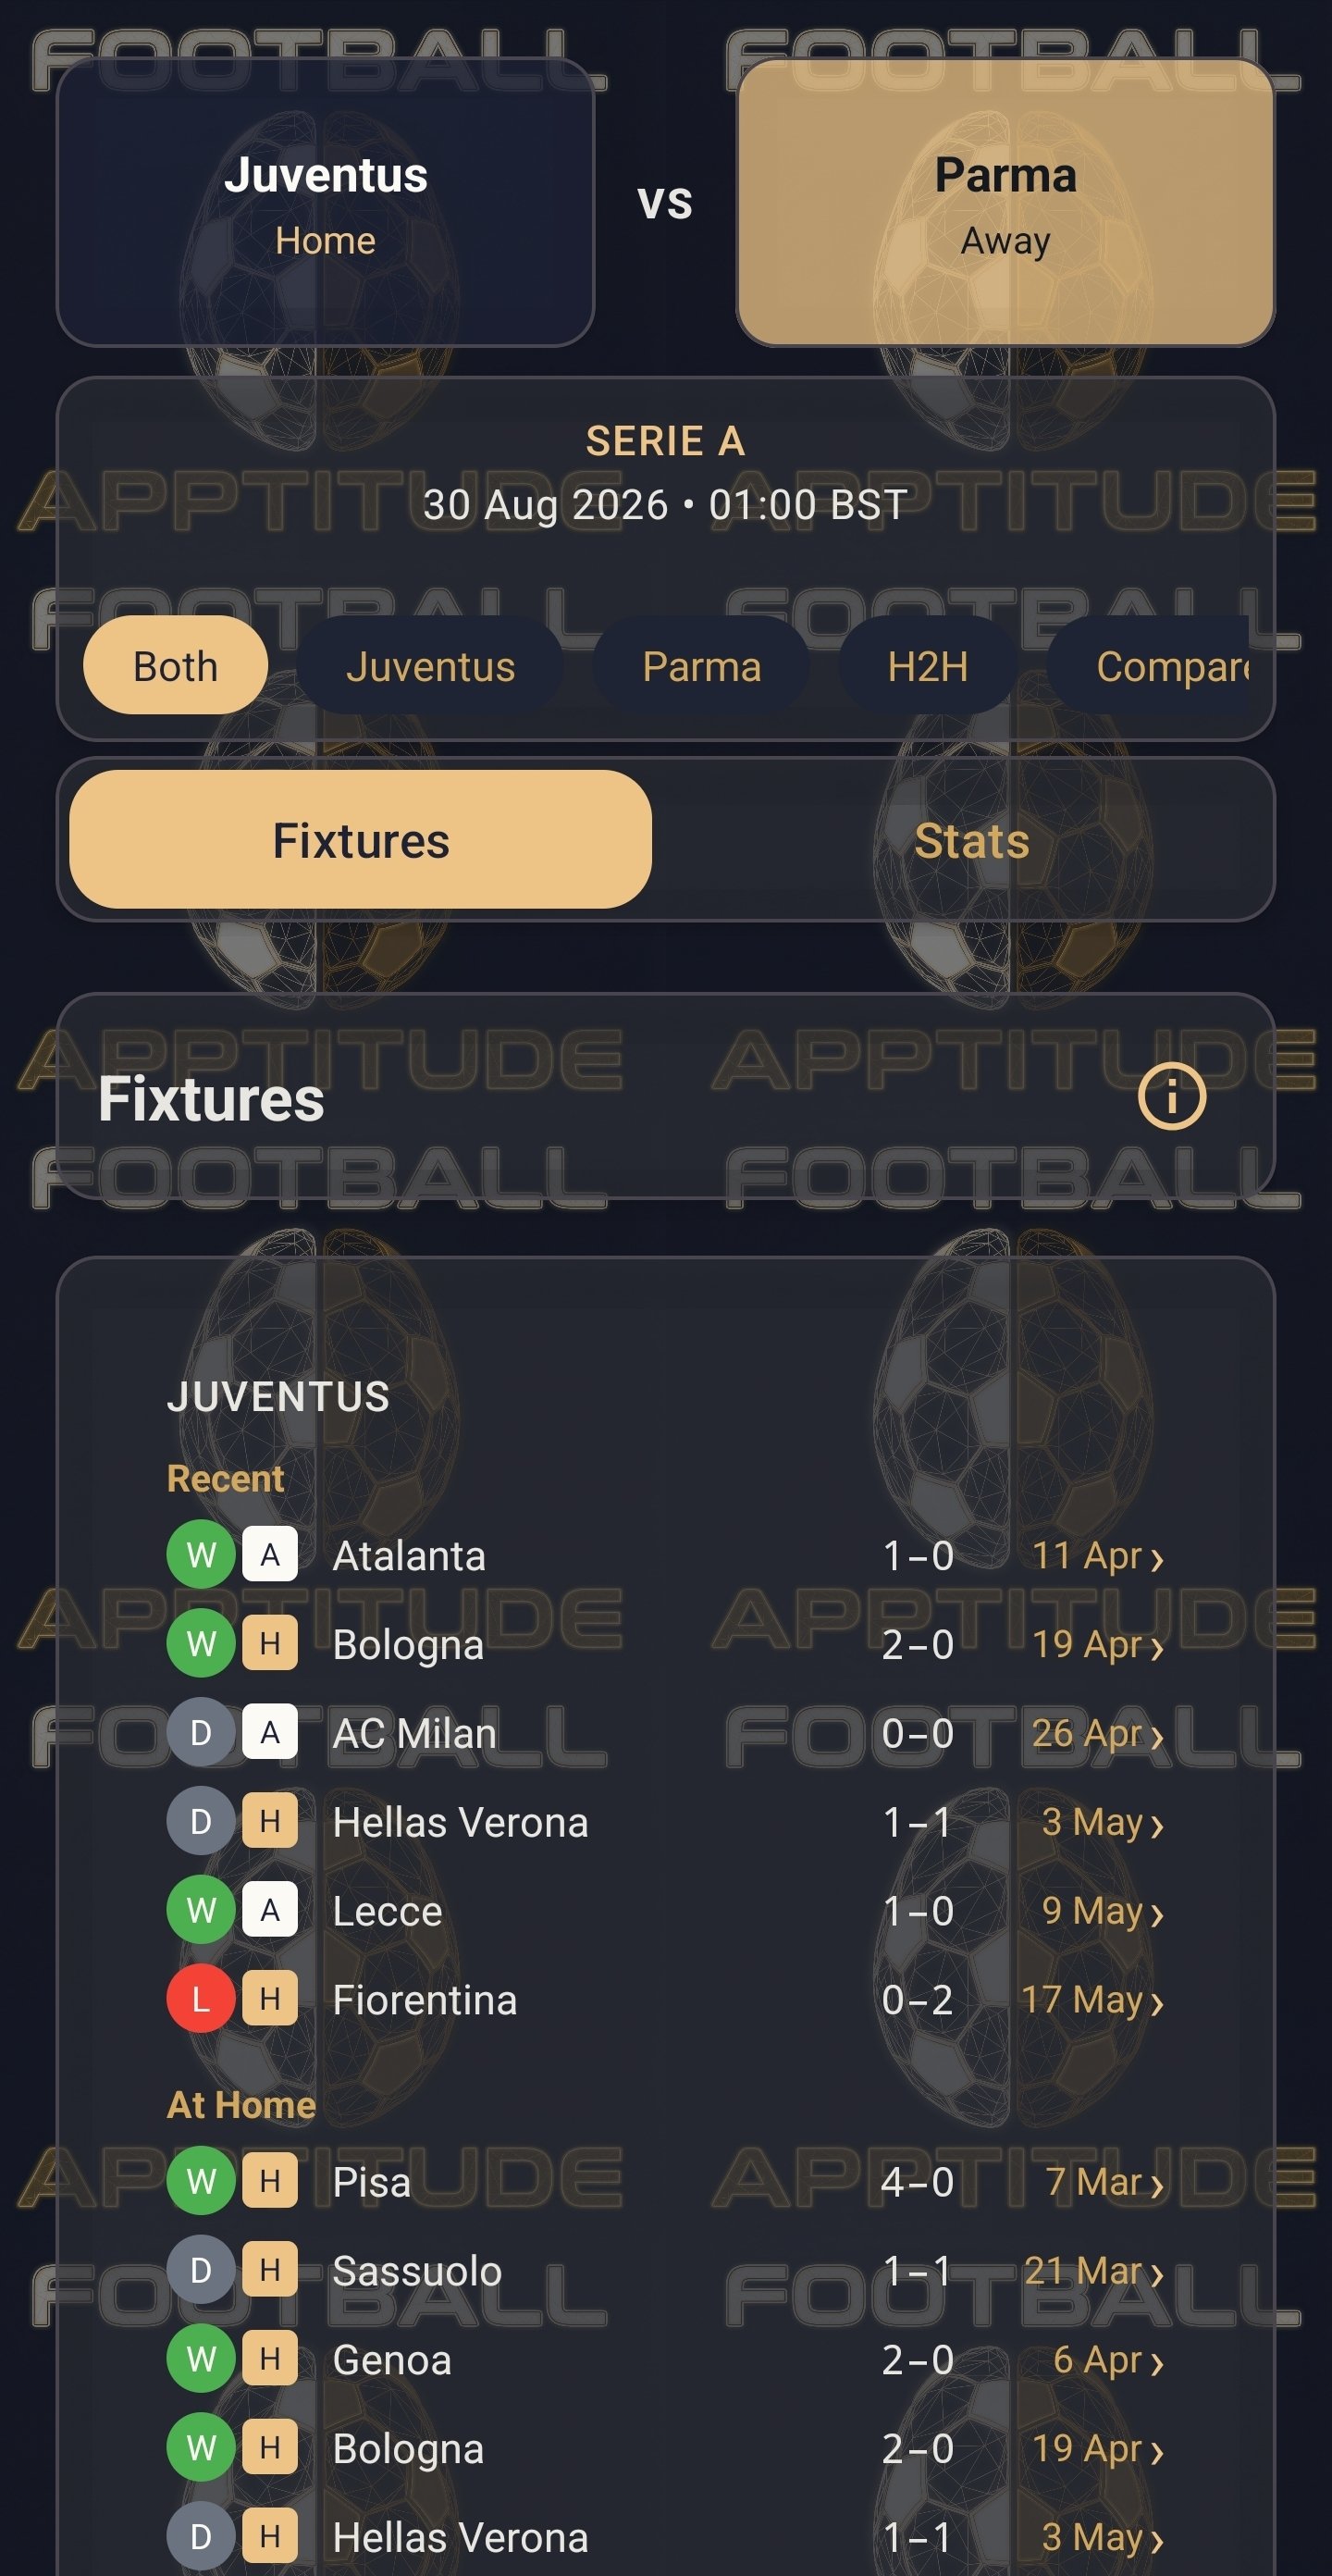
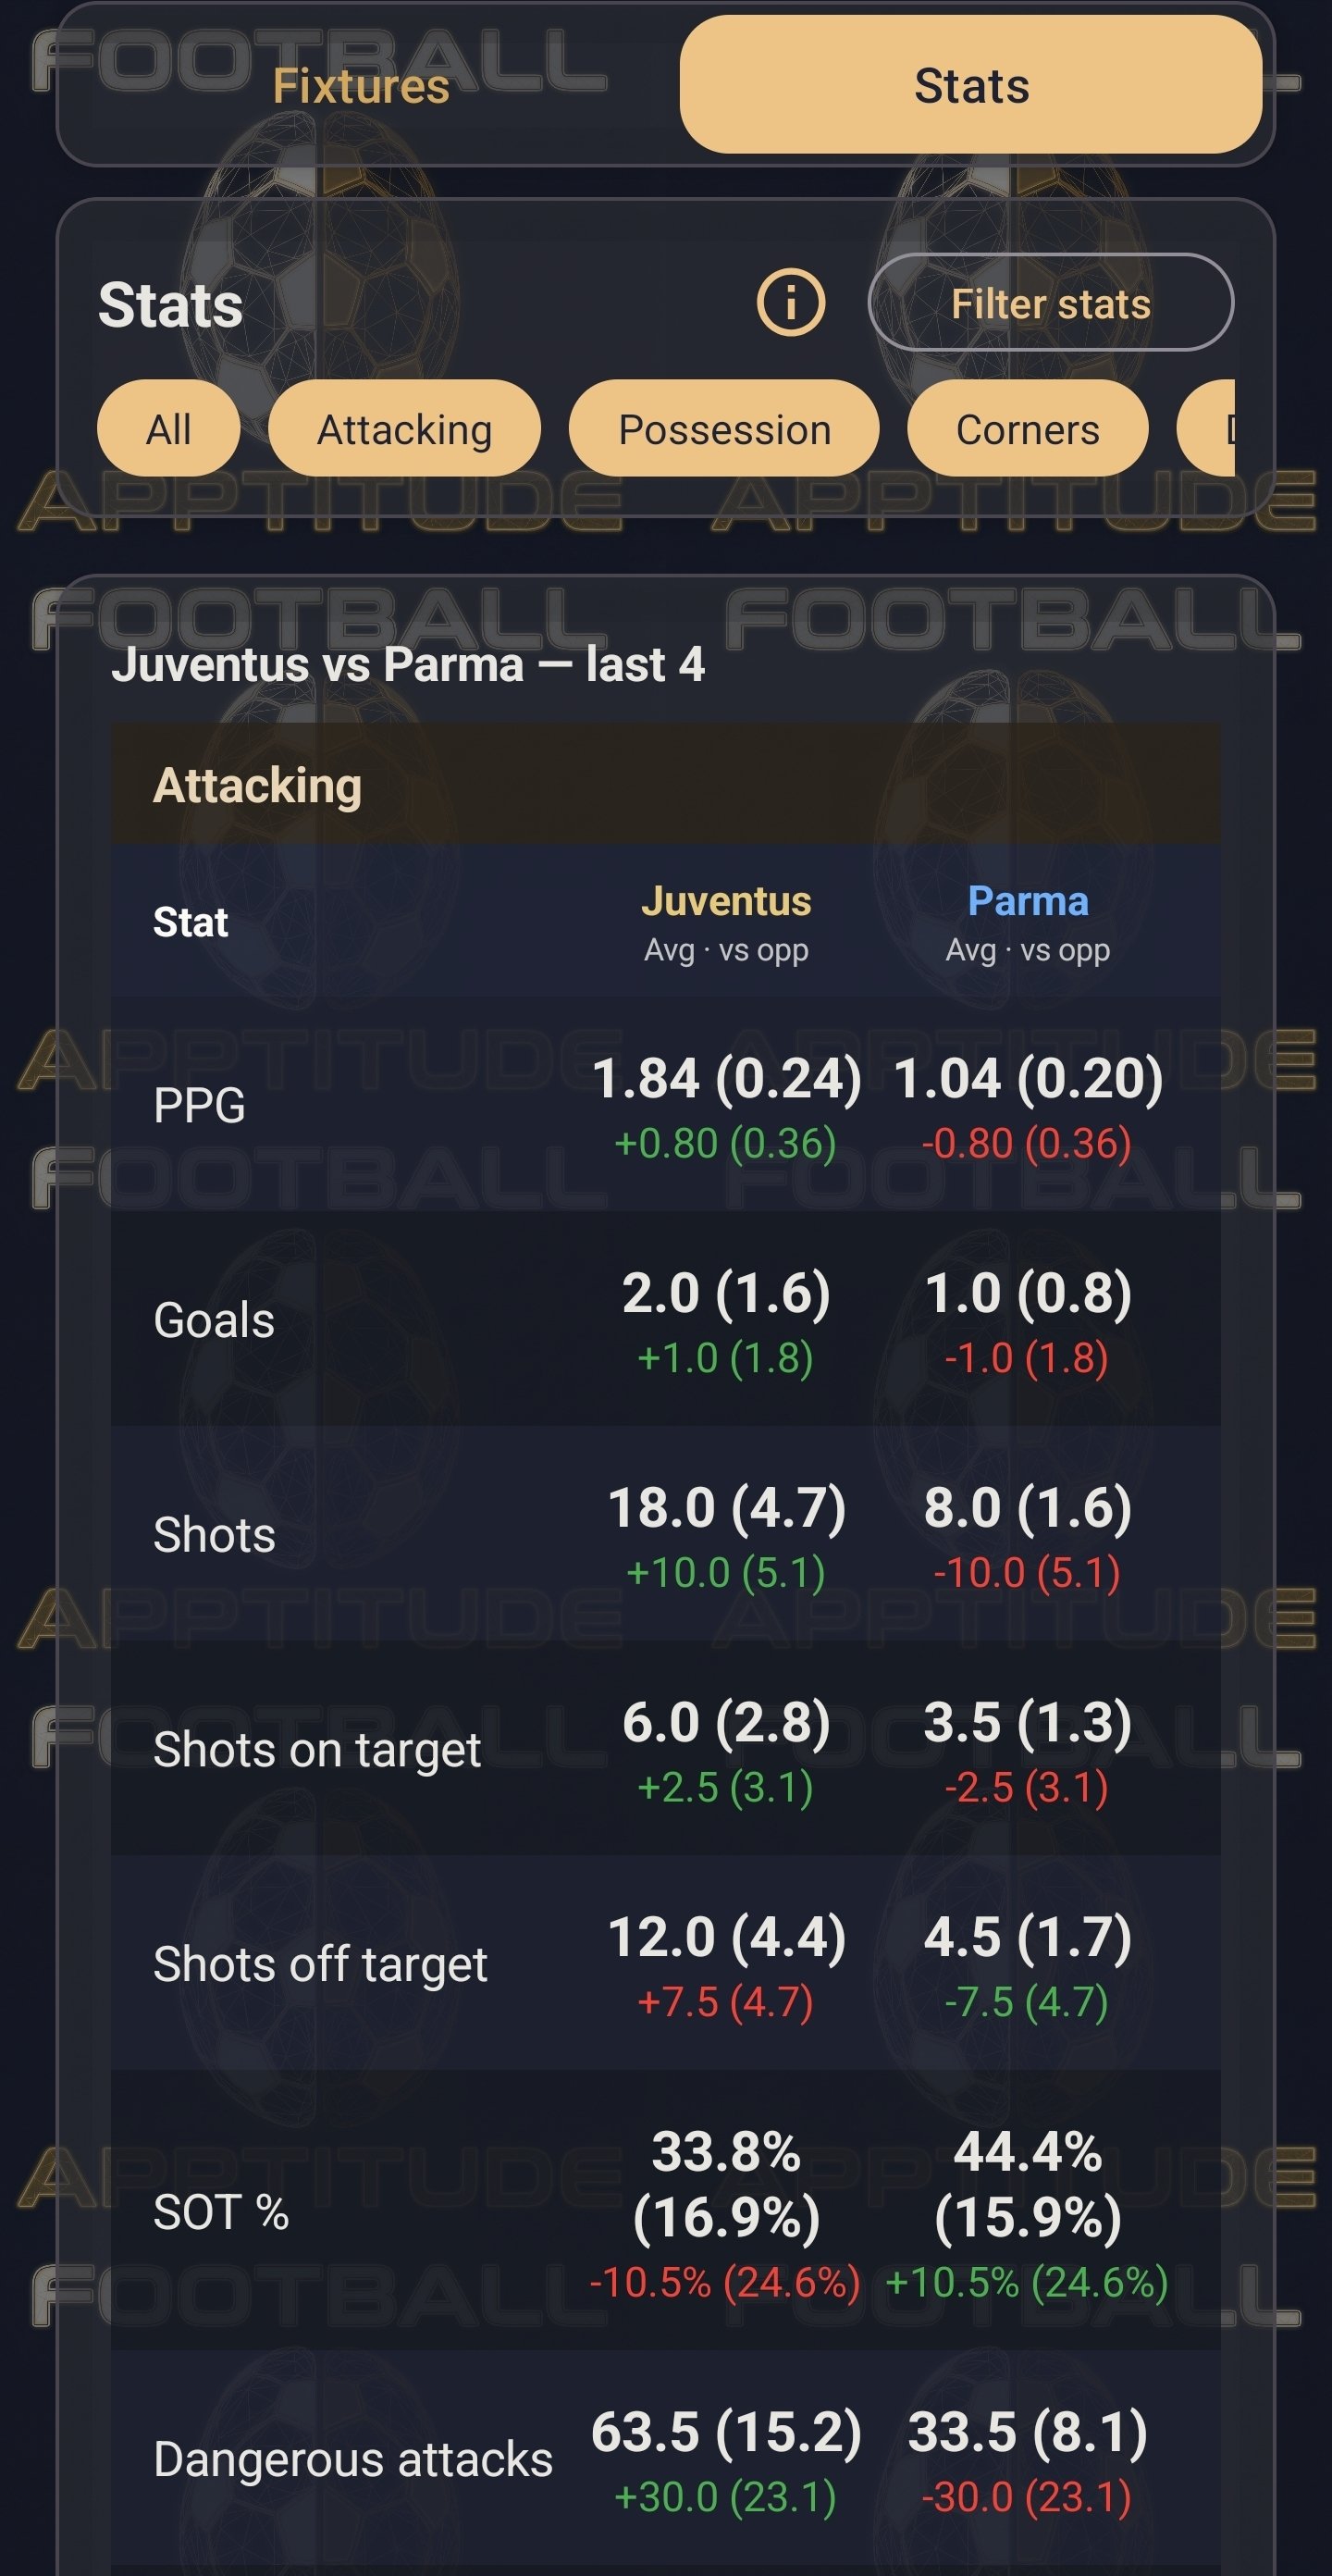
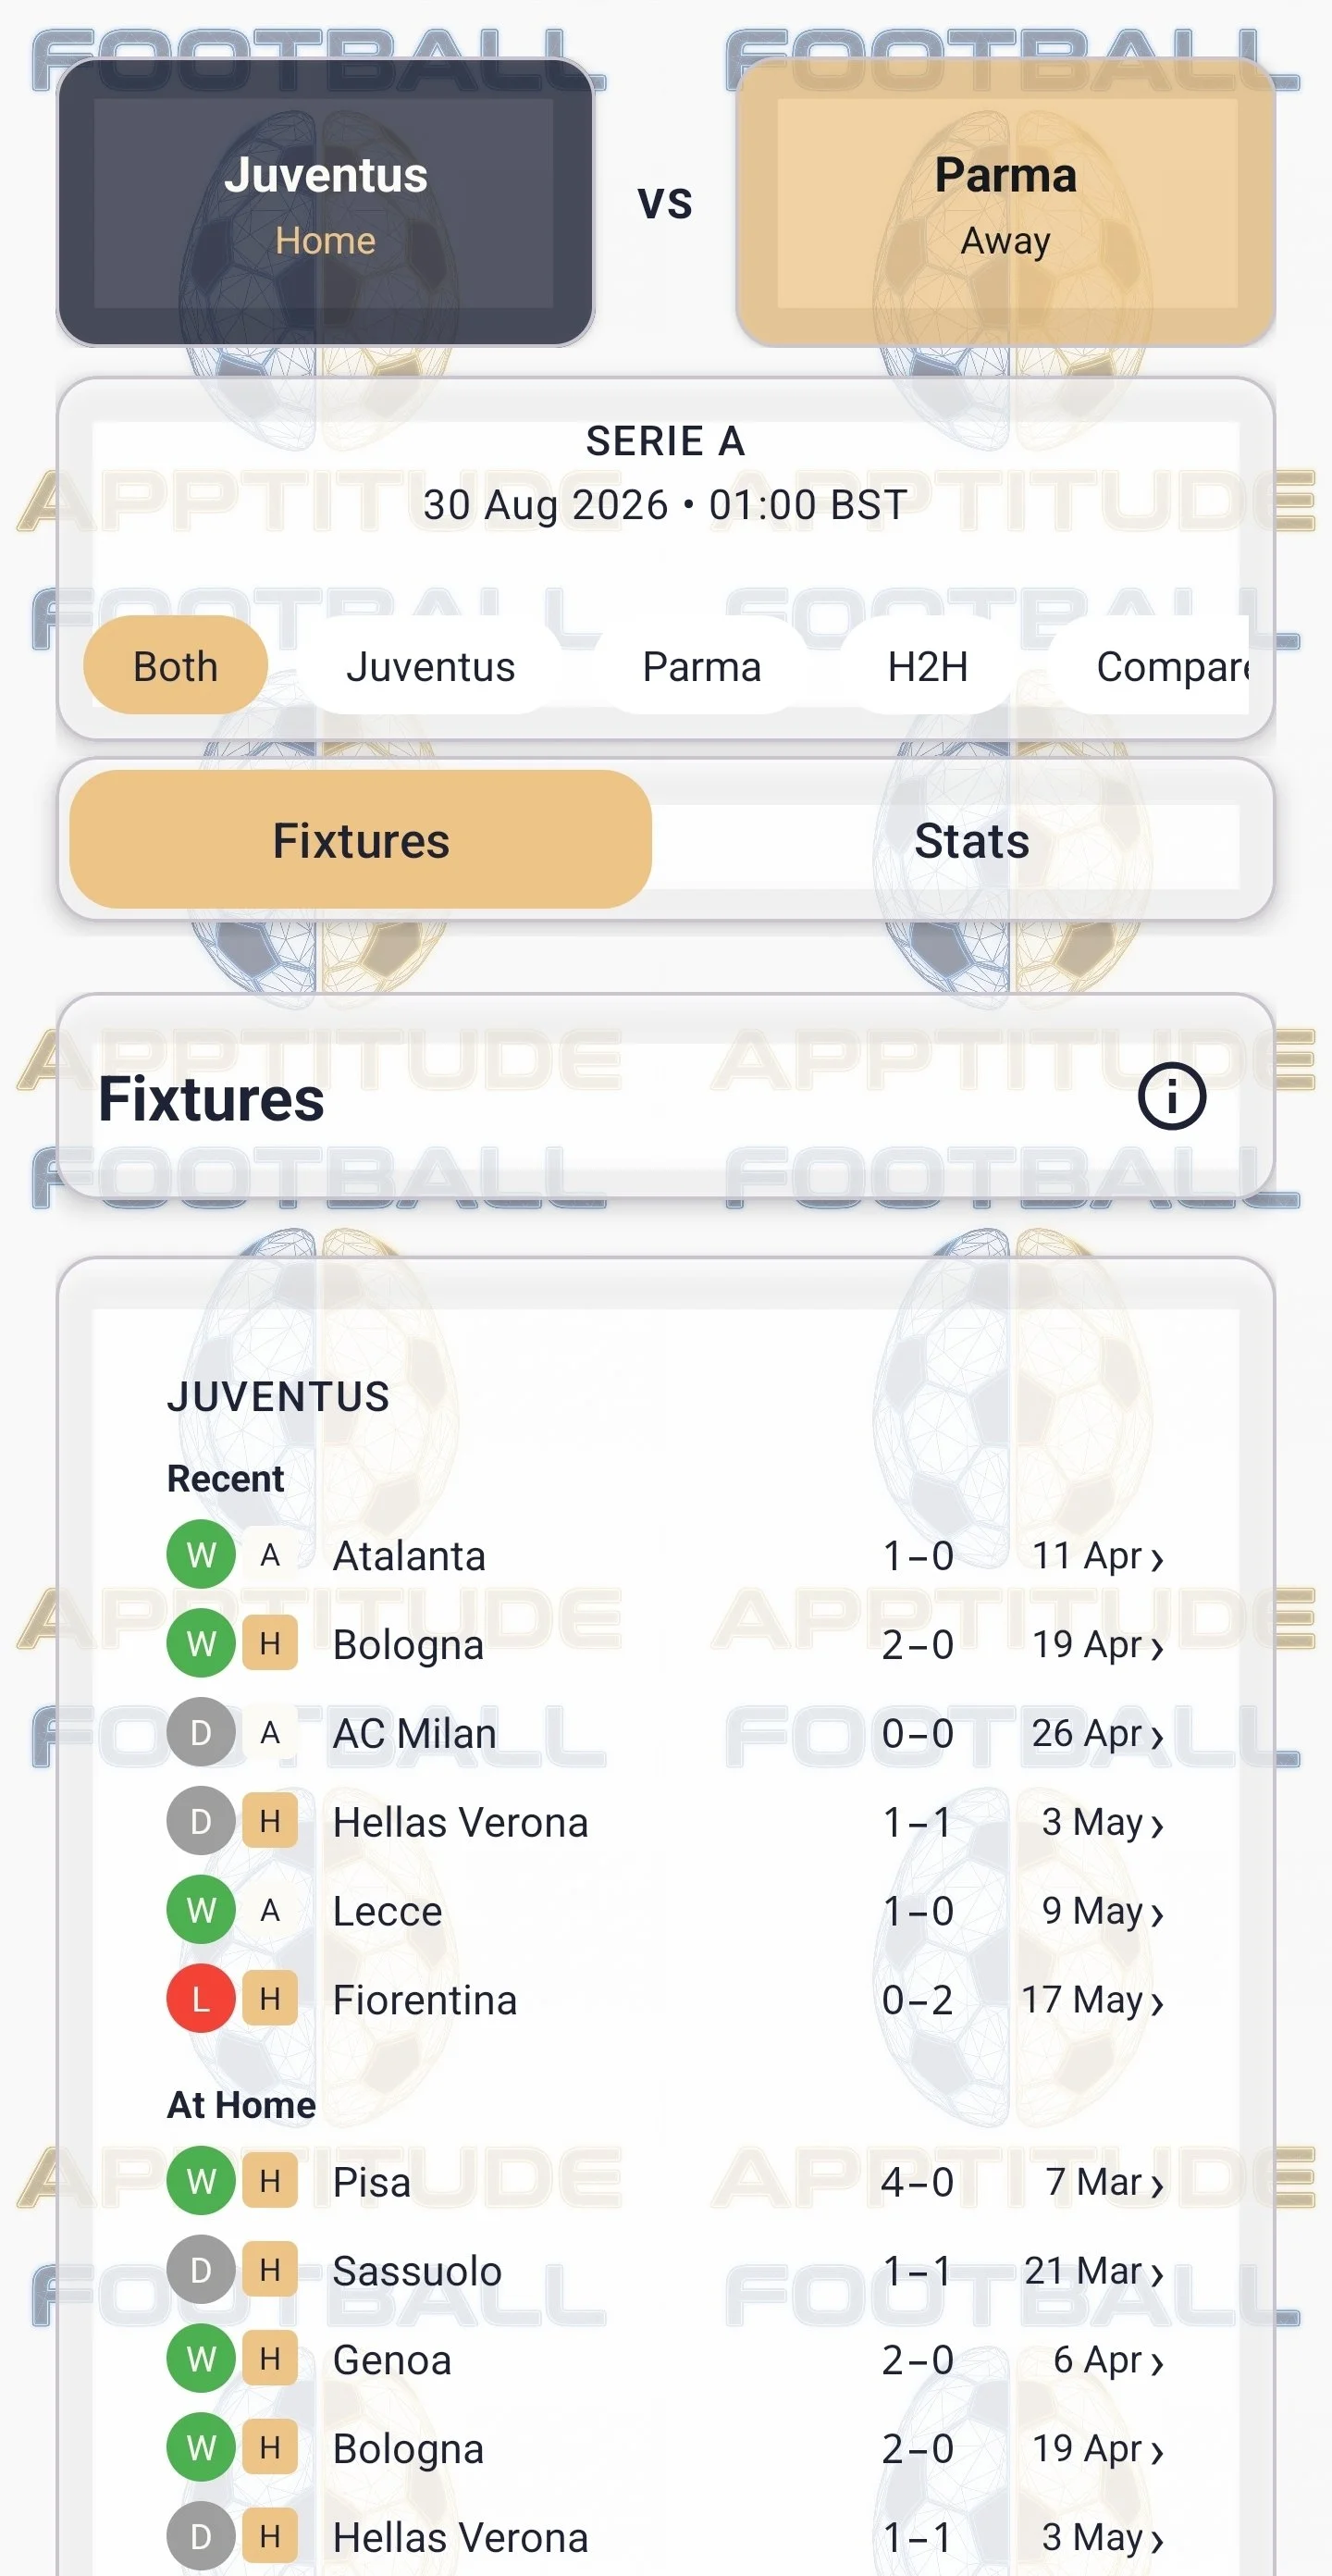
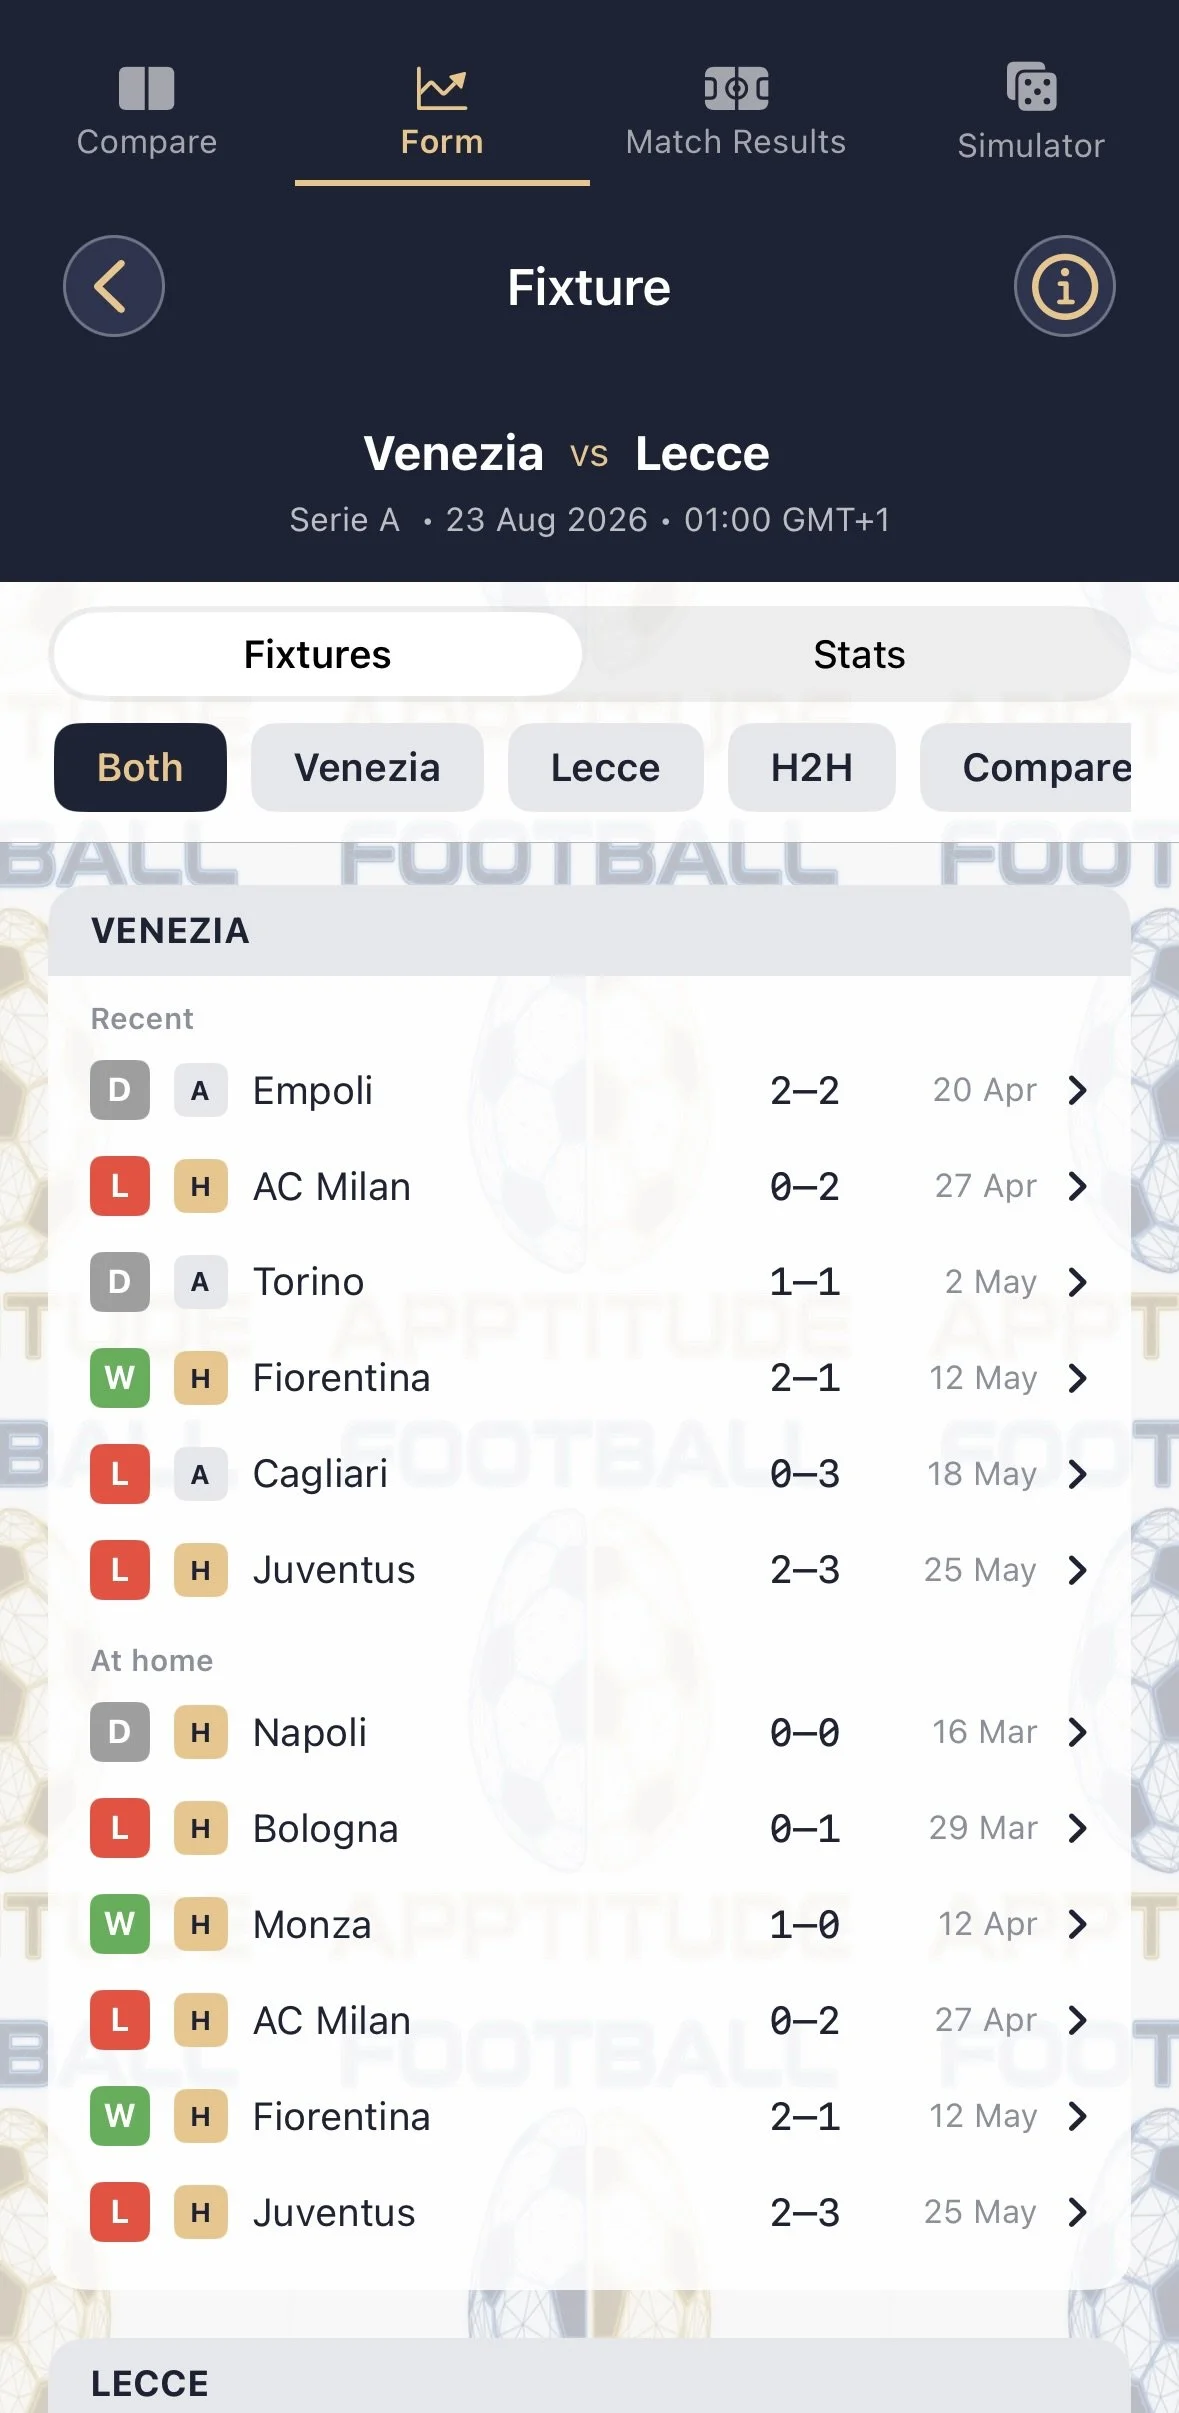
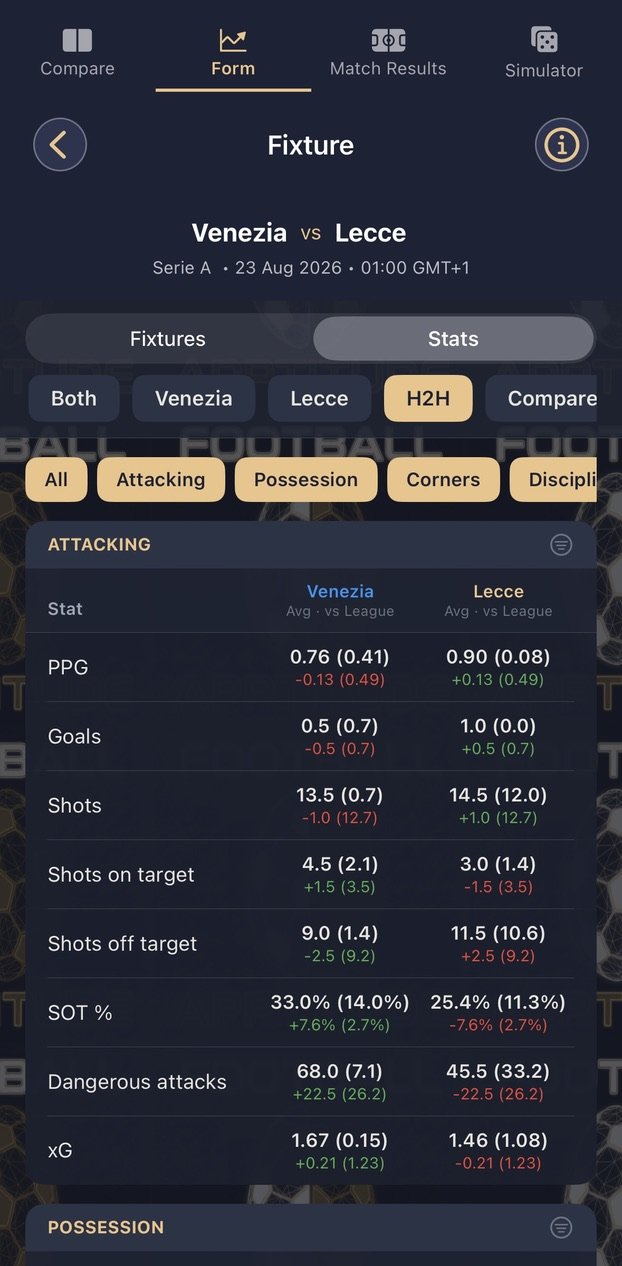
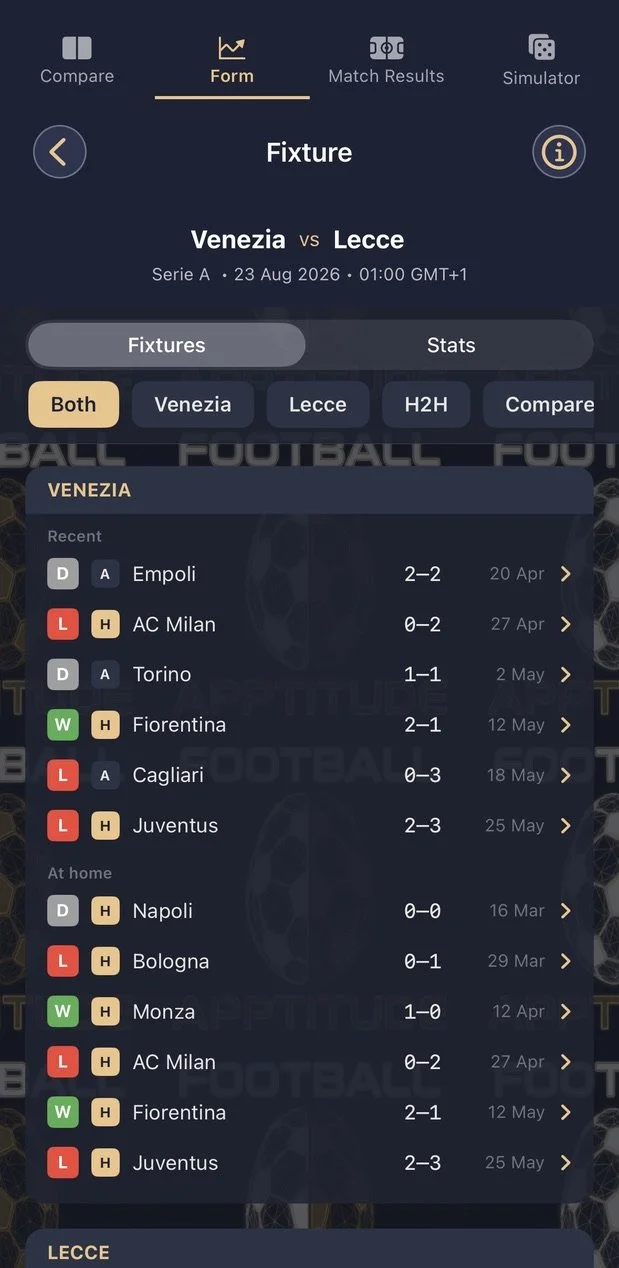
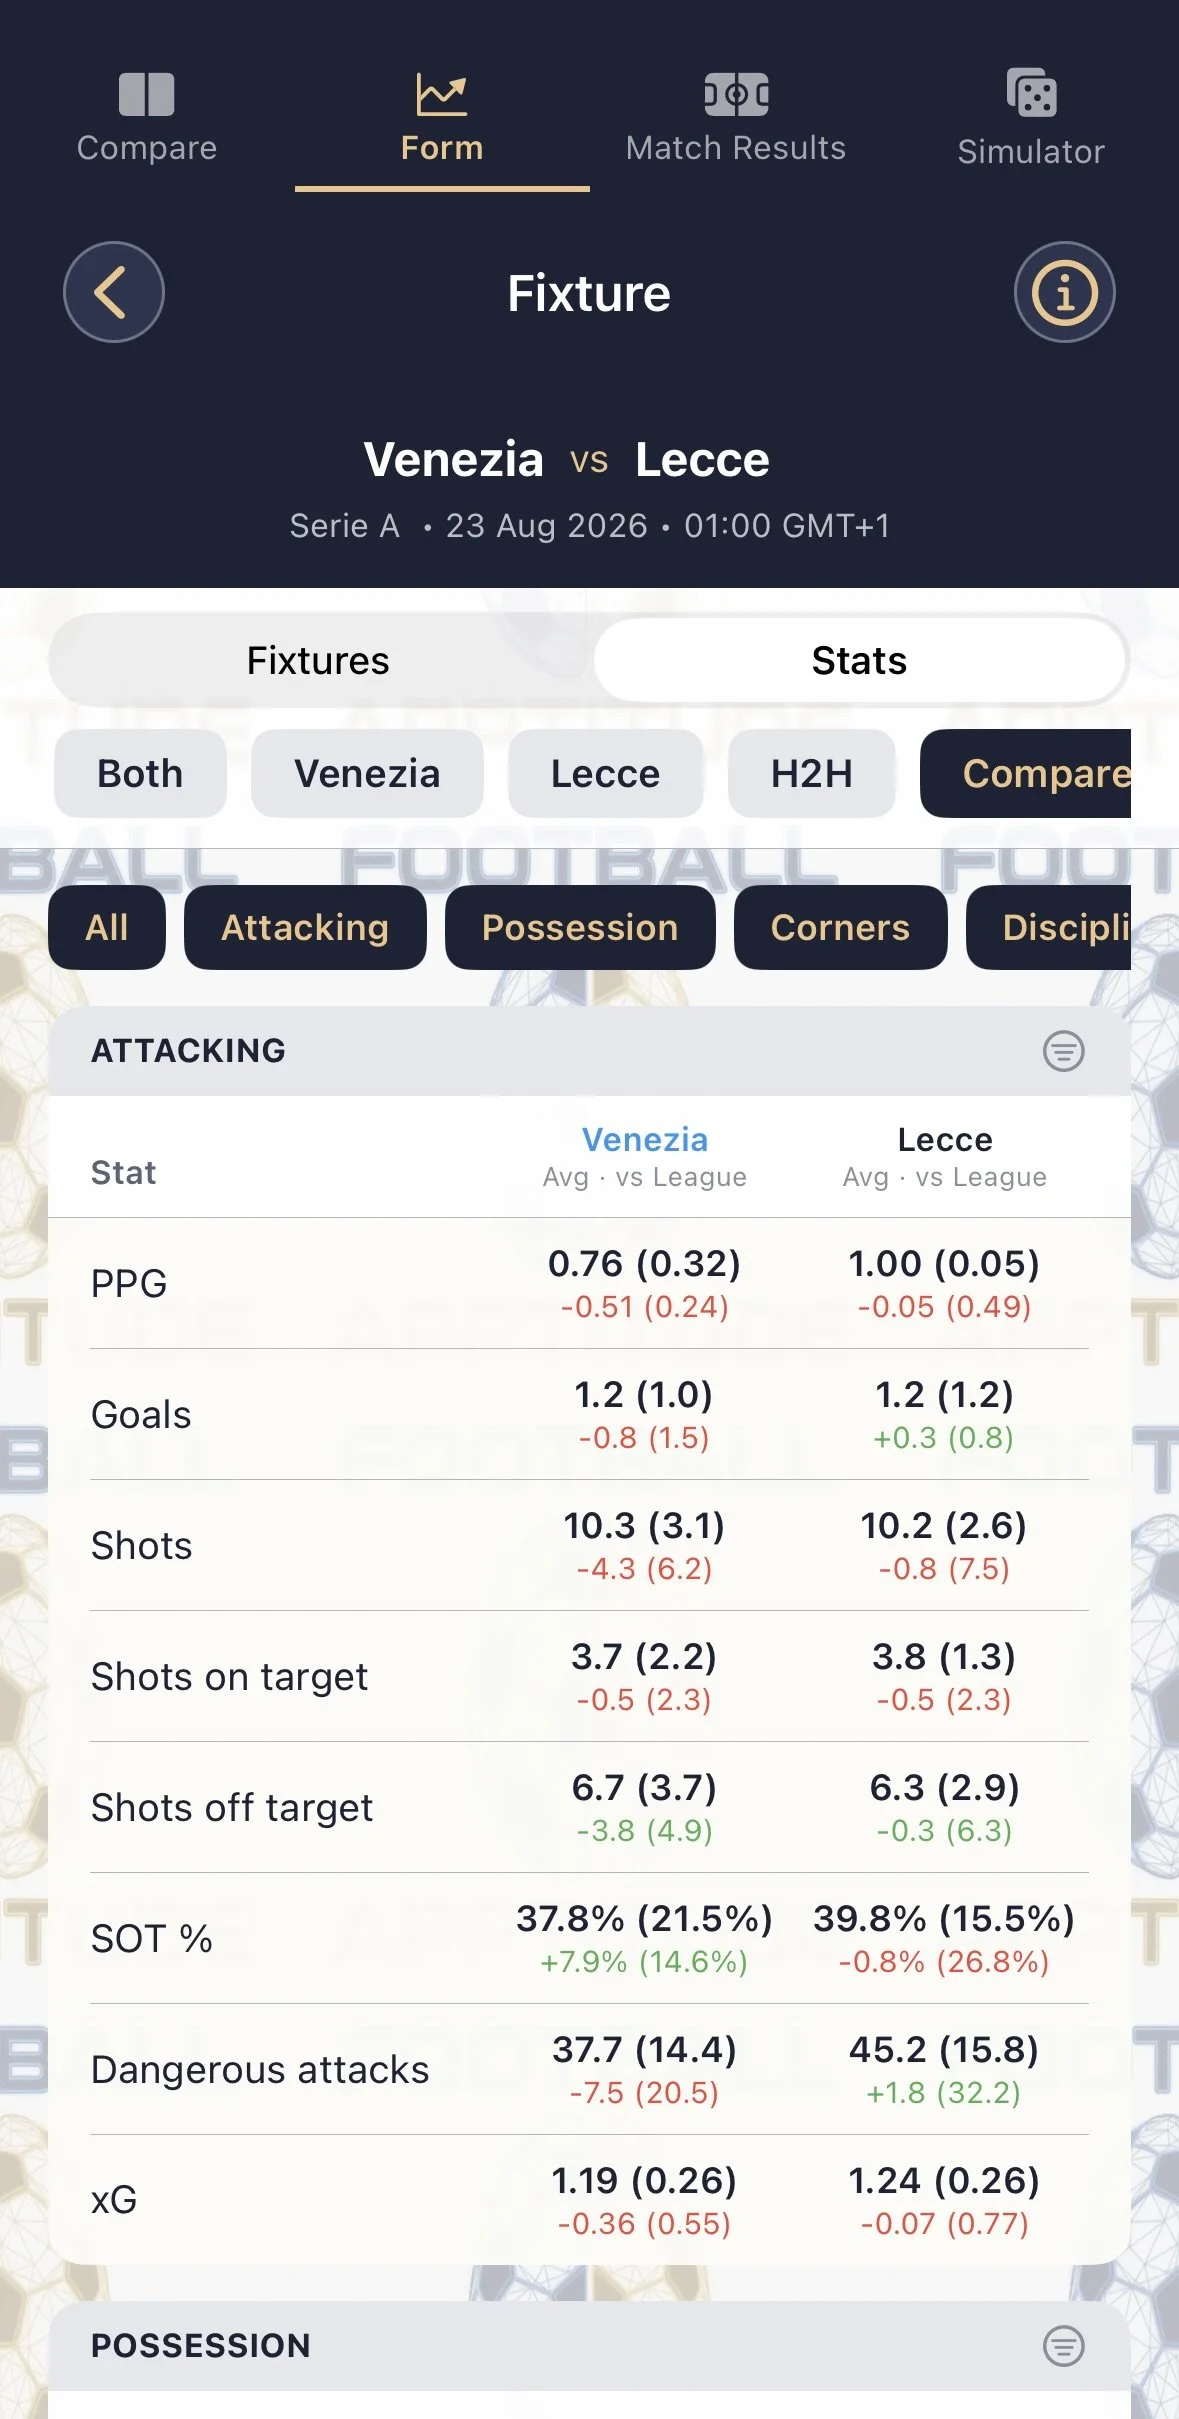
Choose an upcoming fixture and view the form for the participating teams.
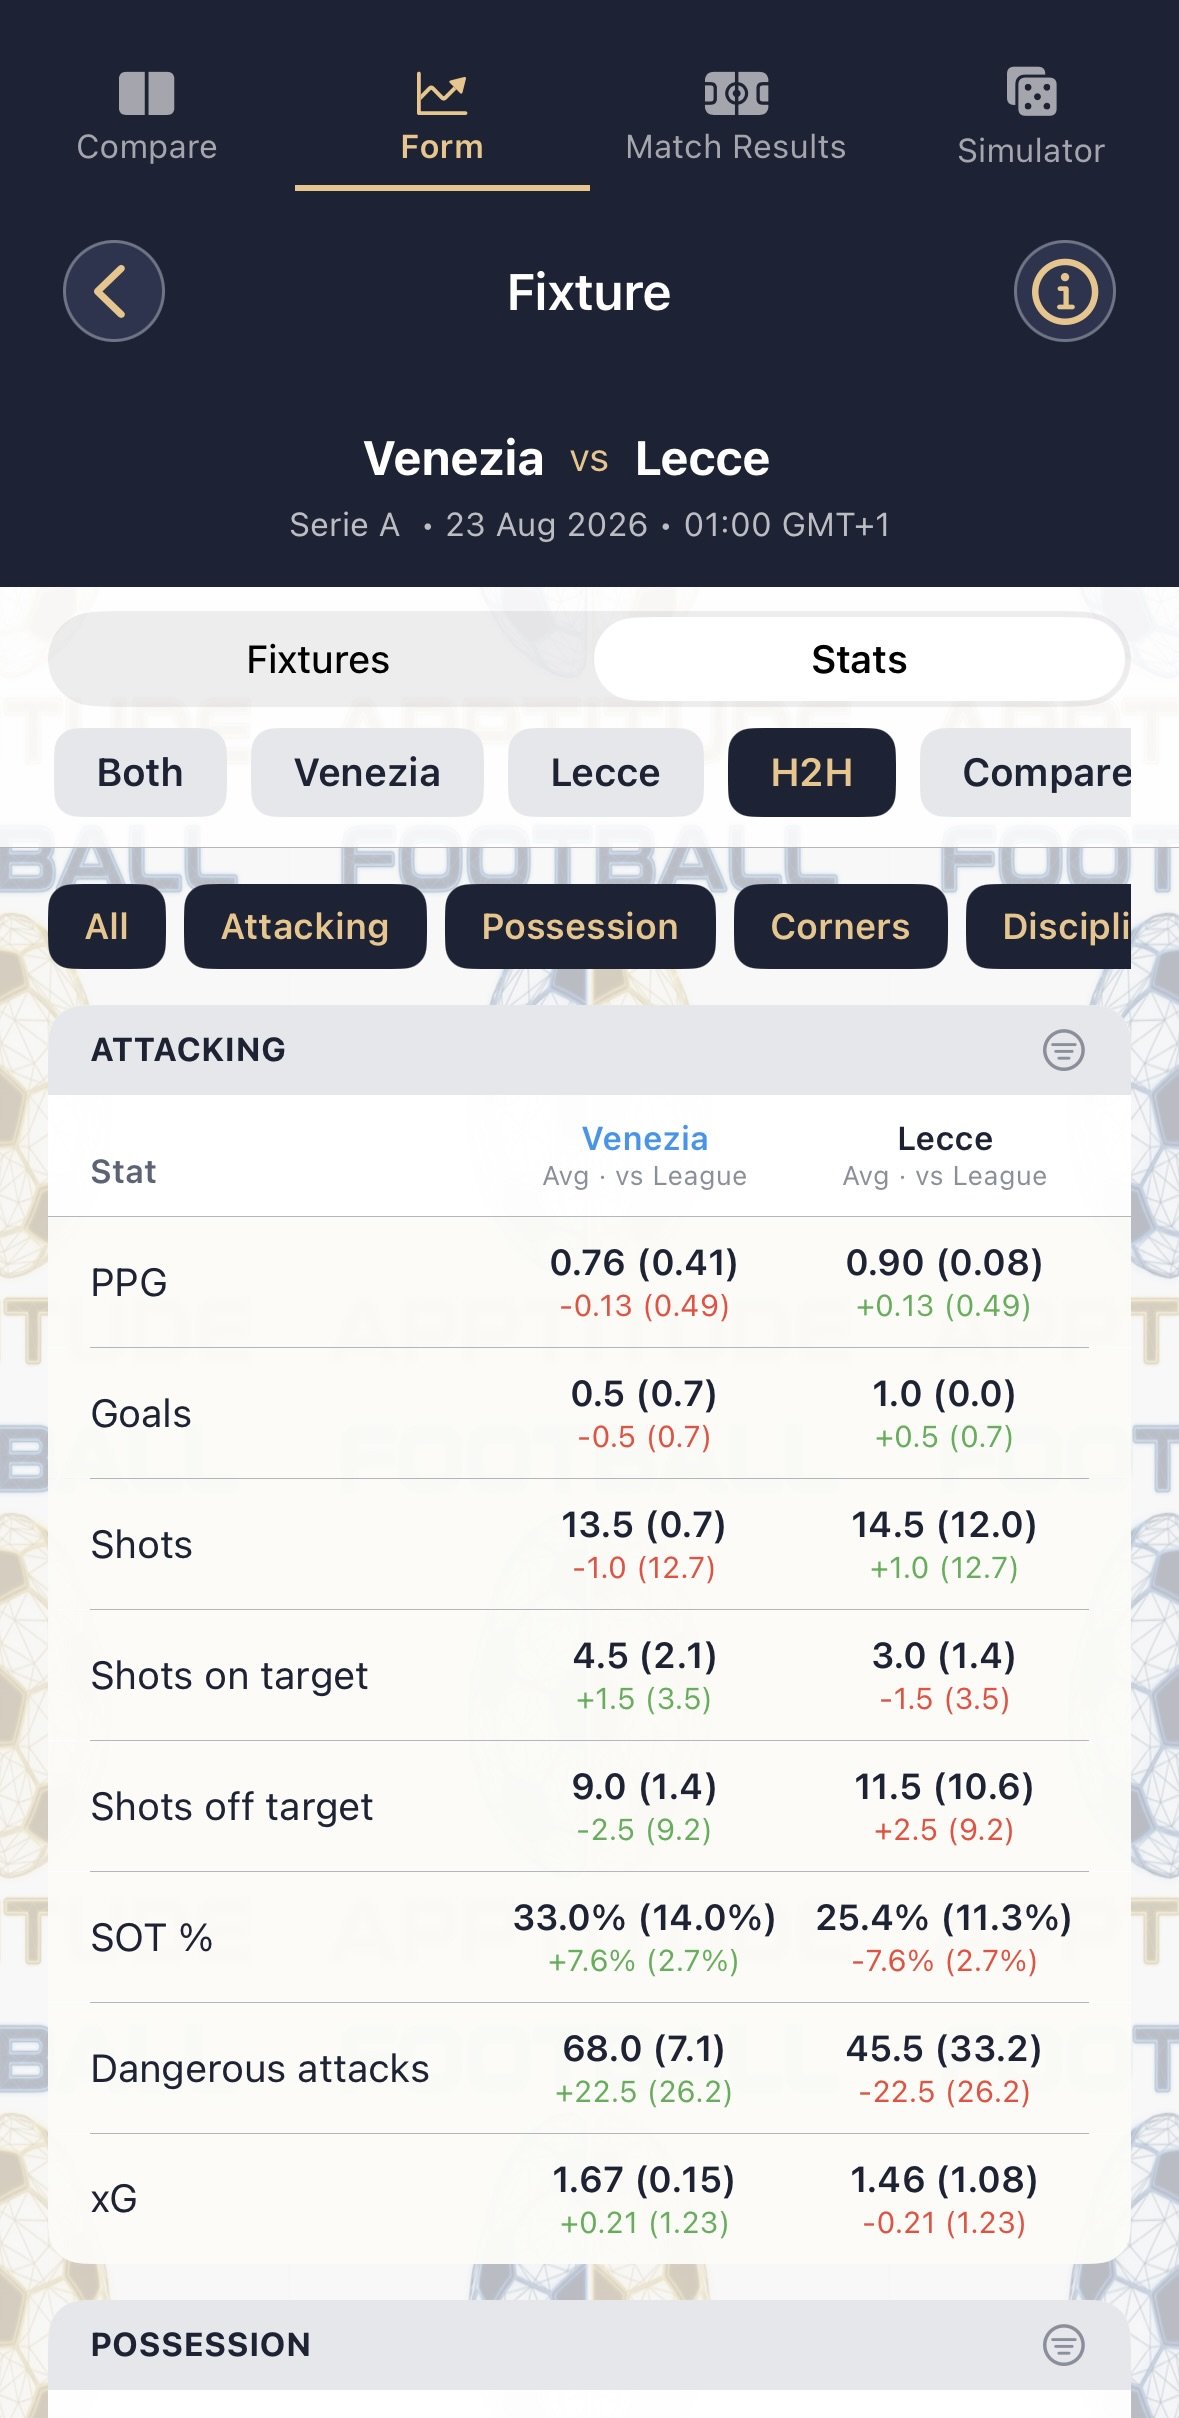
View the form for the last 6 fixtures, last six venue specific fixtures and the las 6 head-to-head meetings of each team.
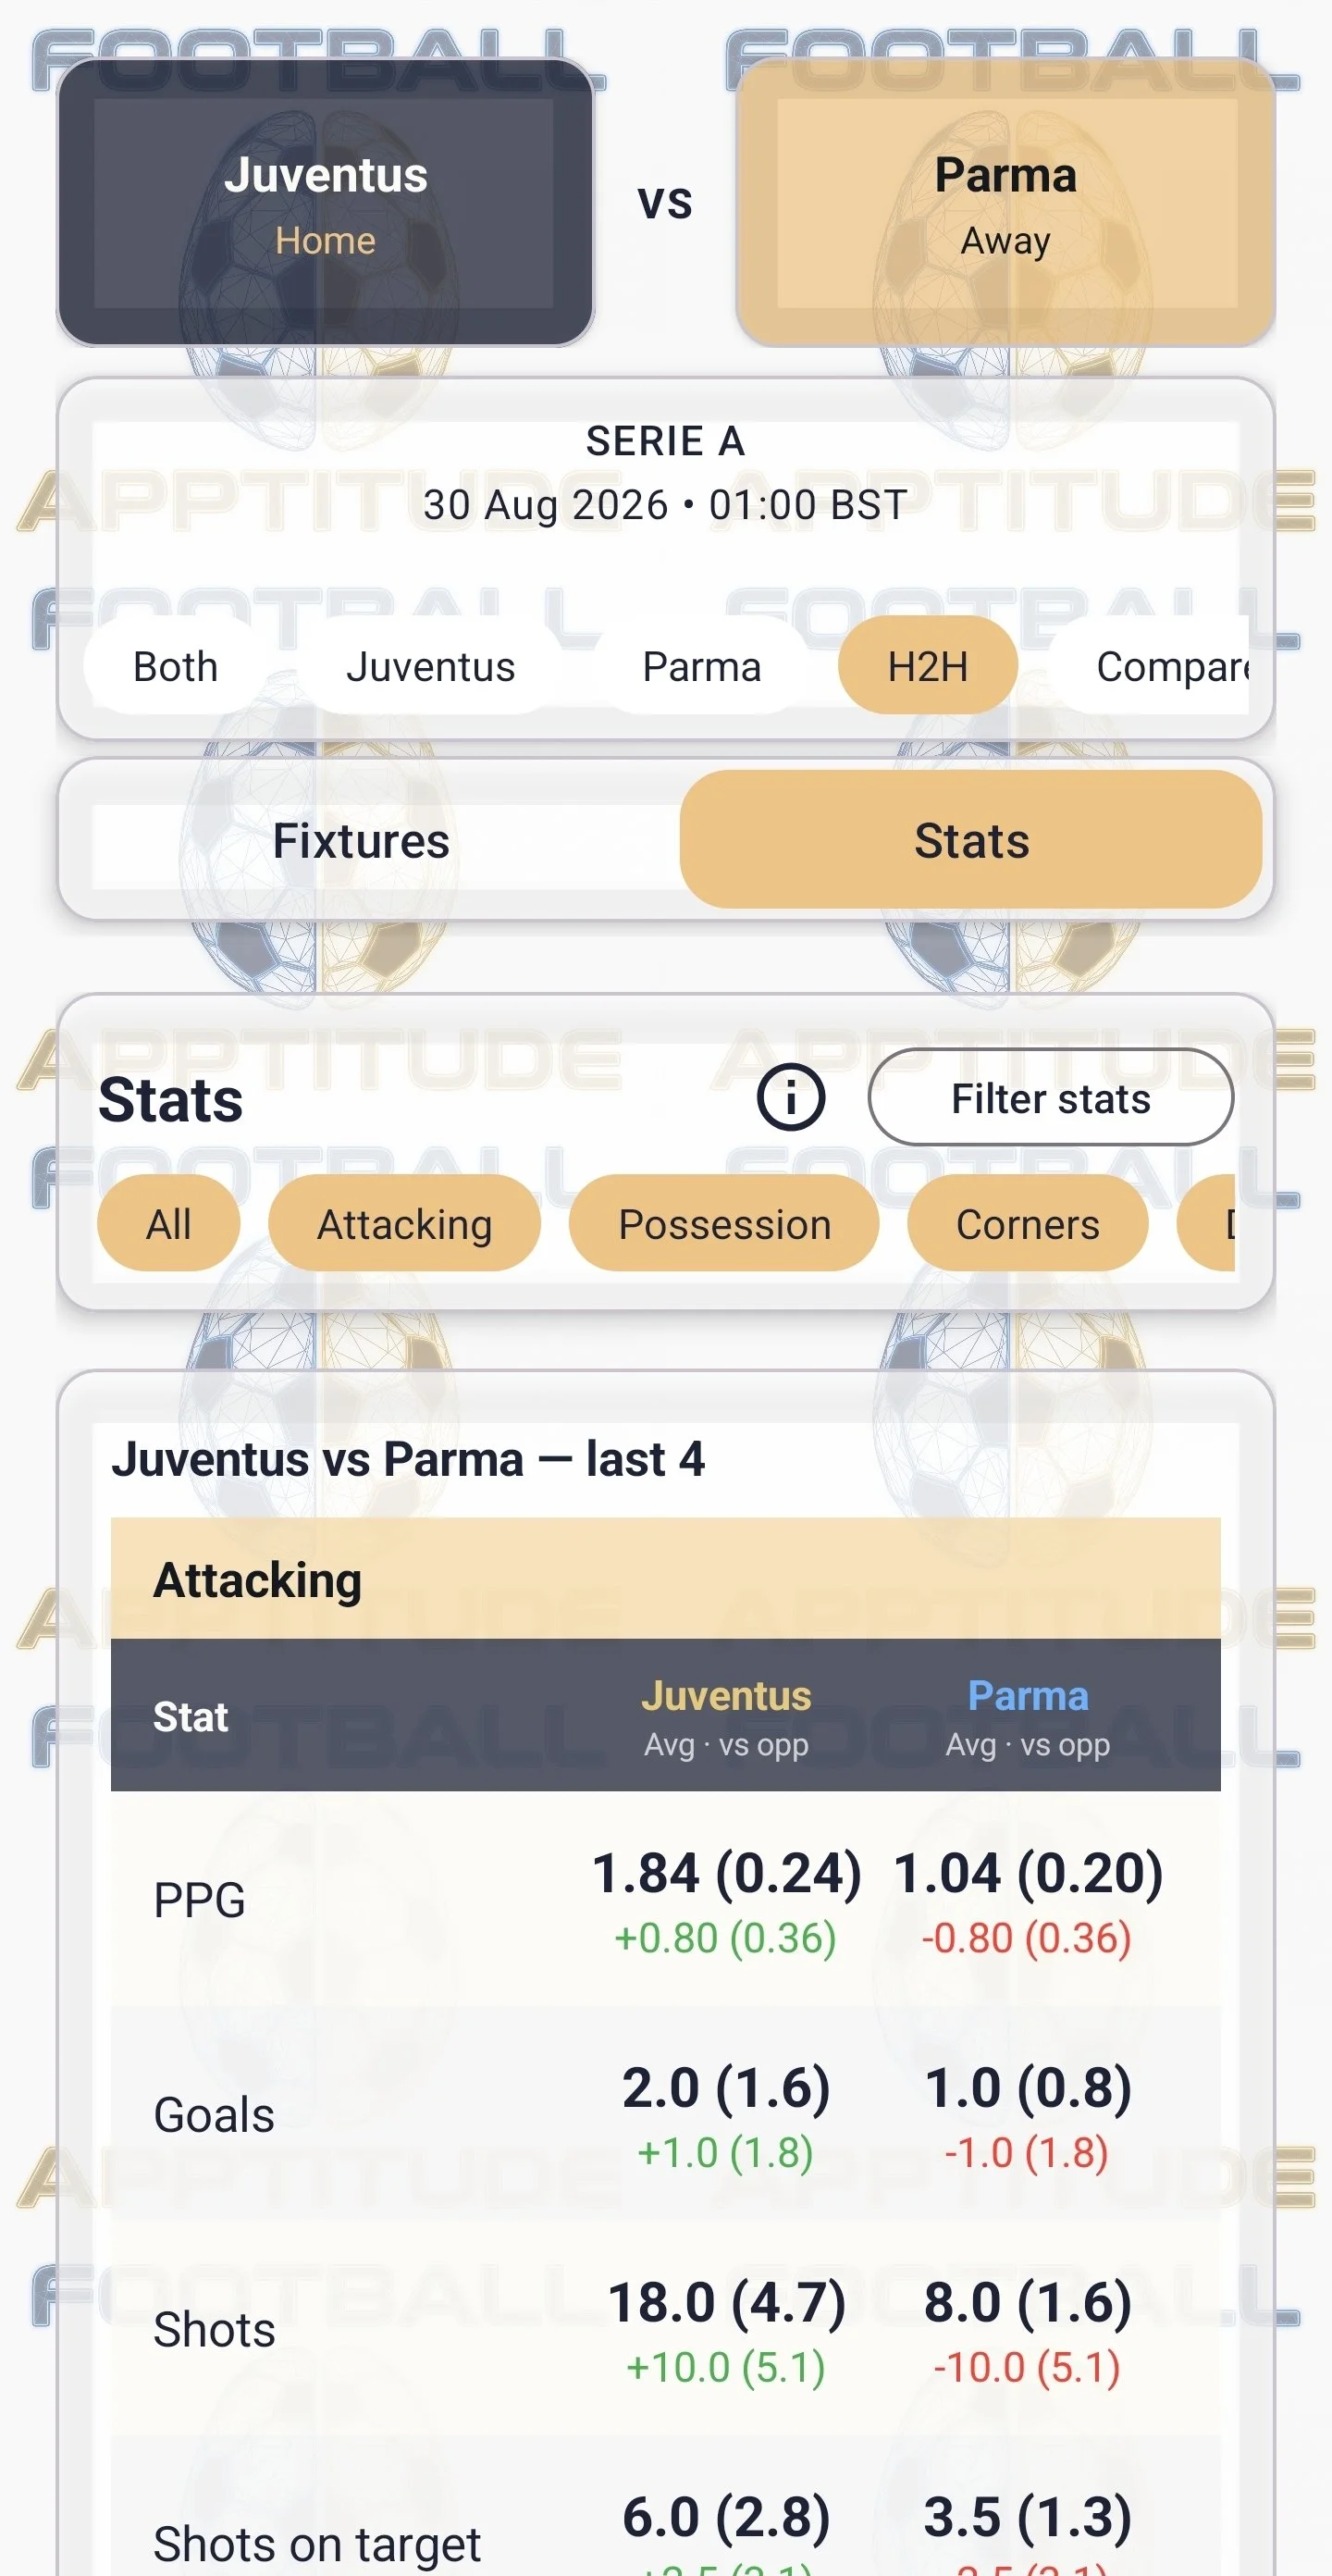
Compare the stats for head to head meeting and how they compare to the team averages to see if the teams are tough opponents of a walkover.
-
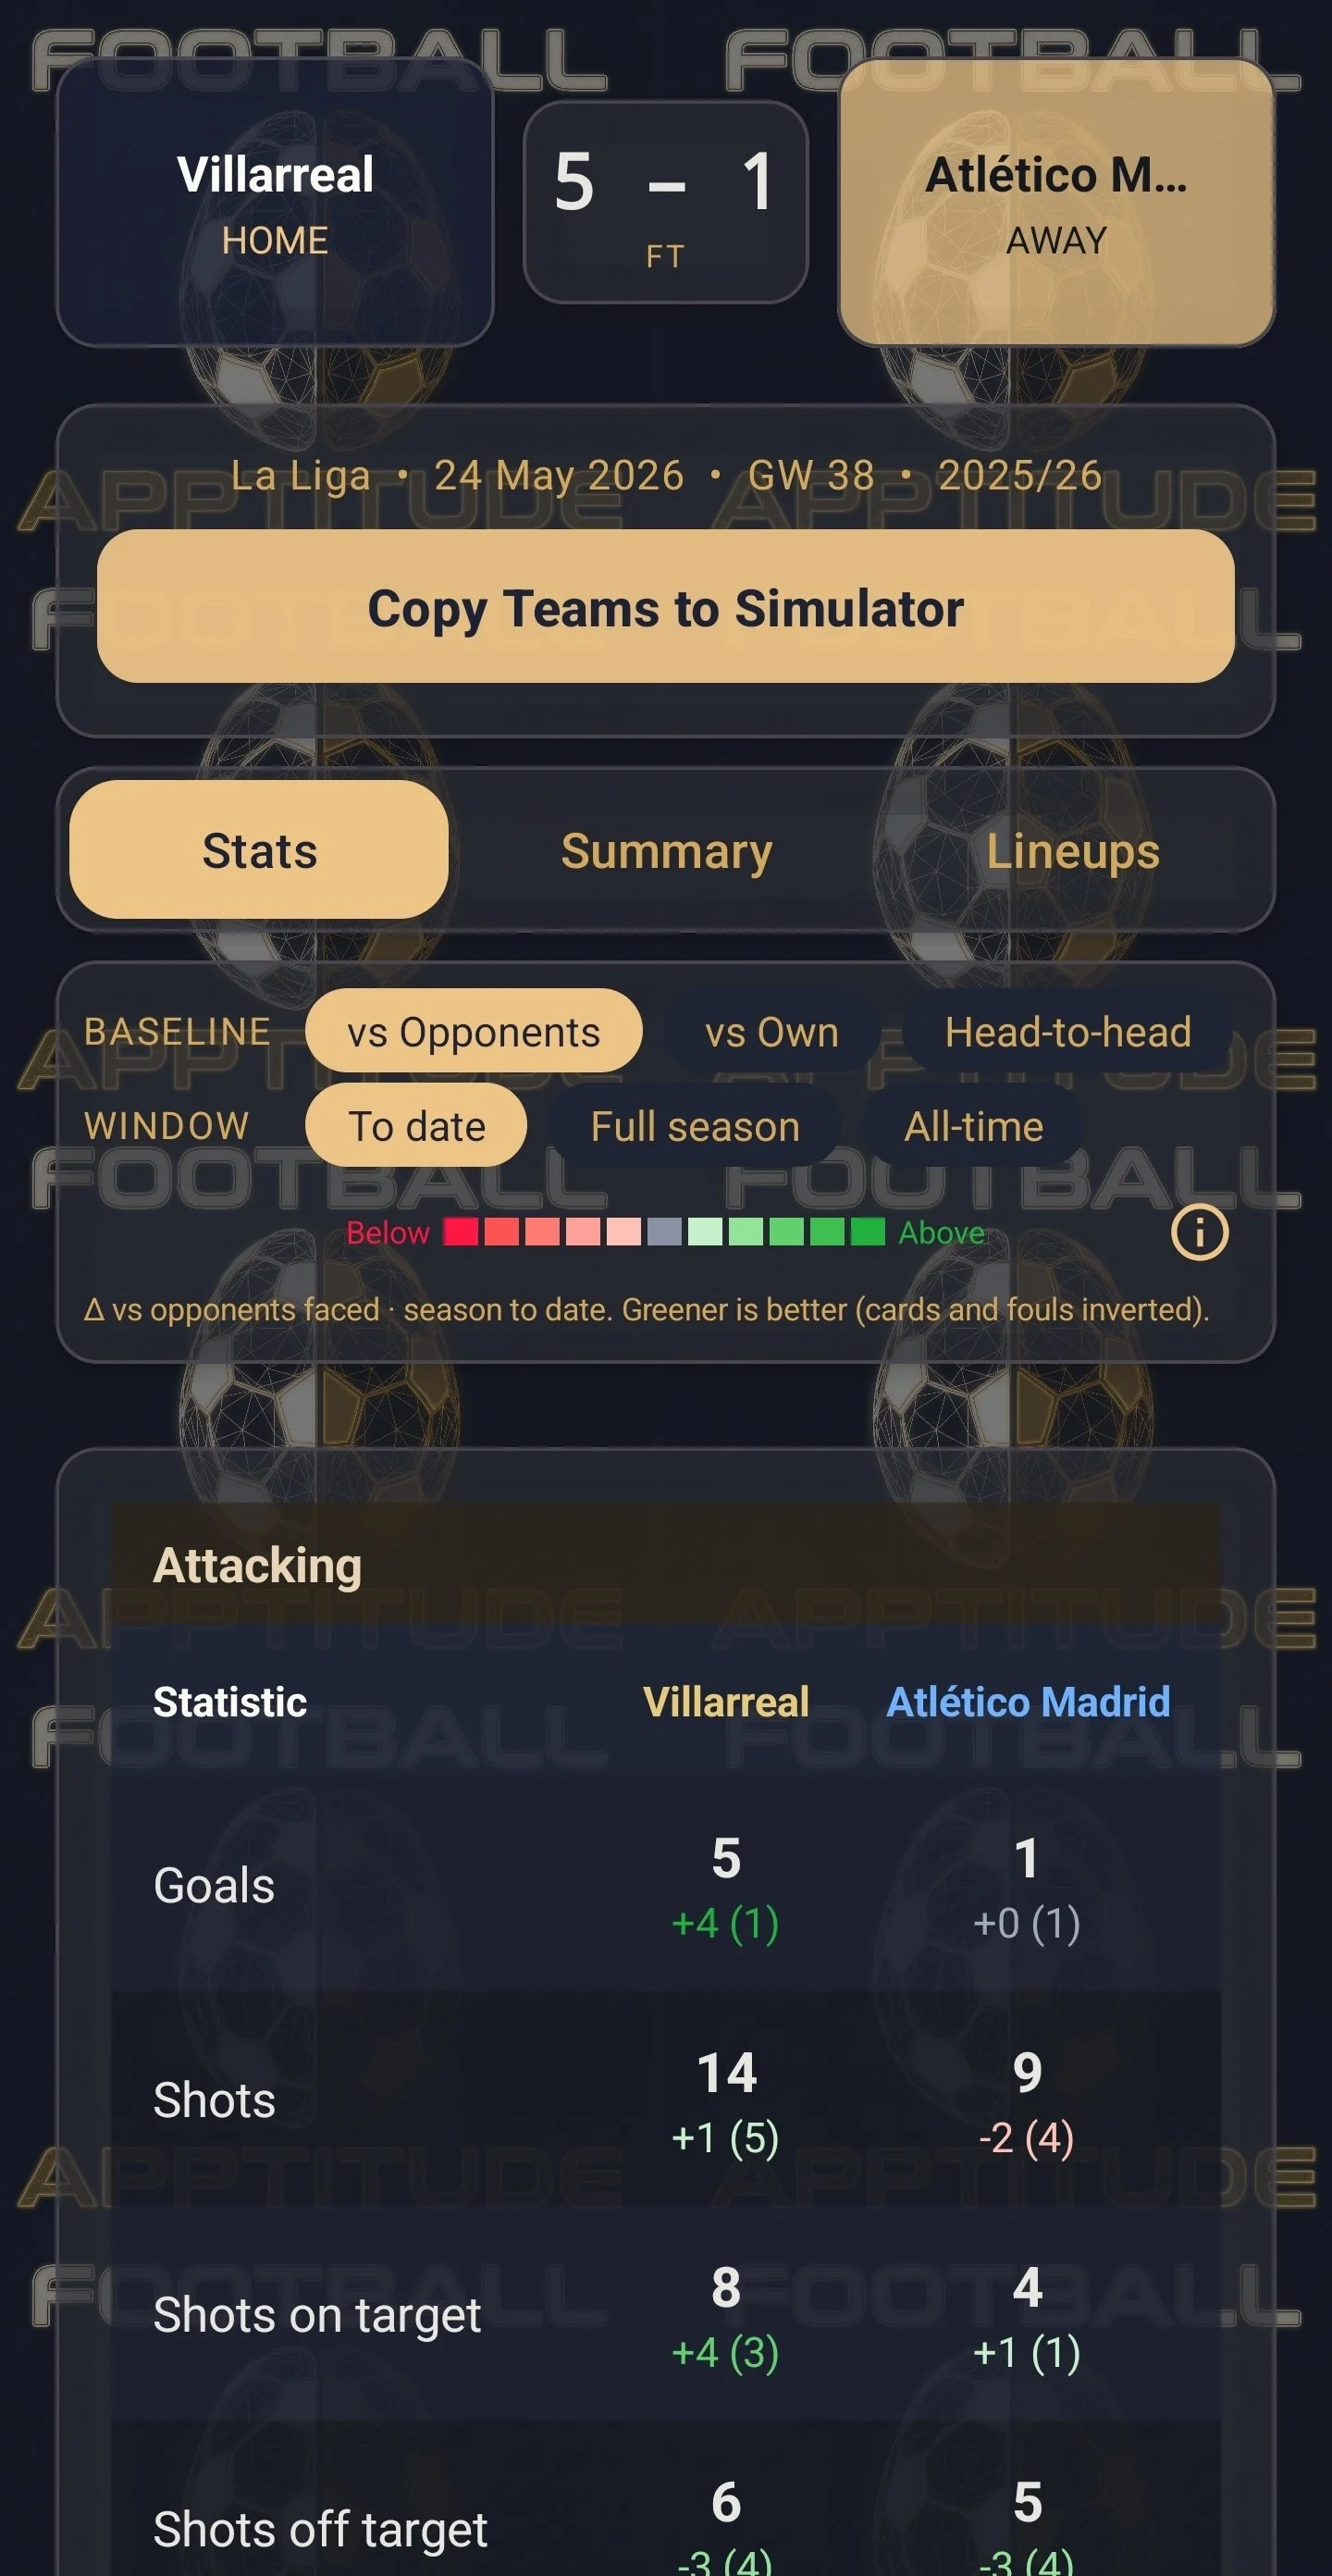
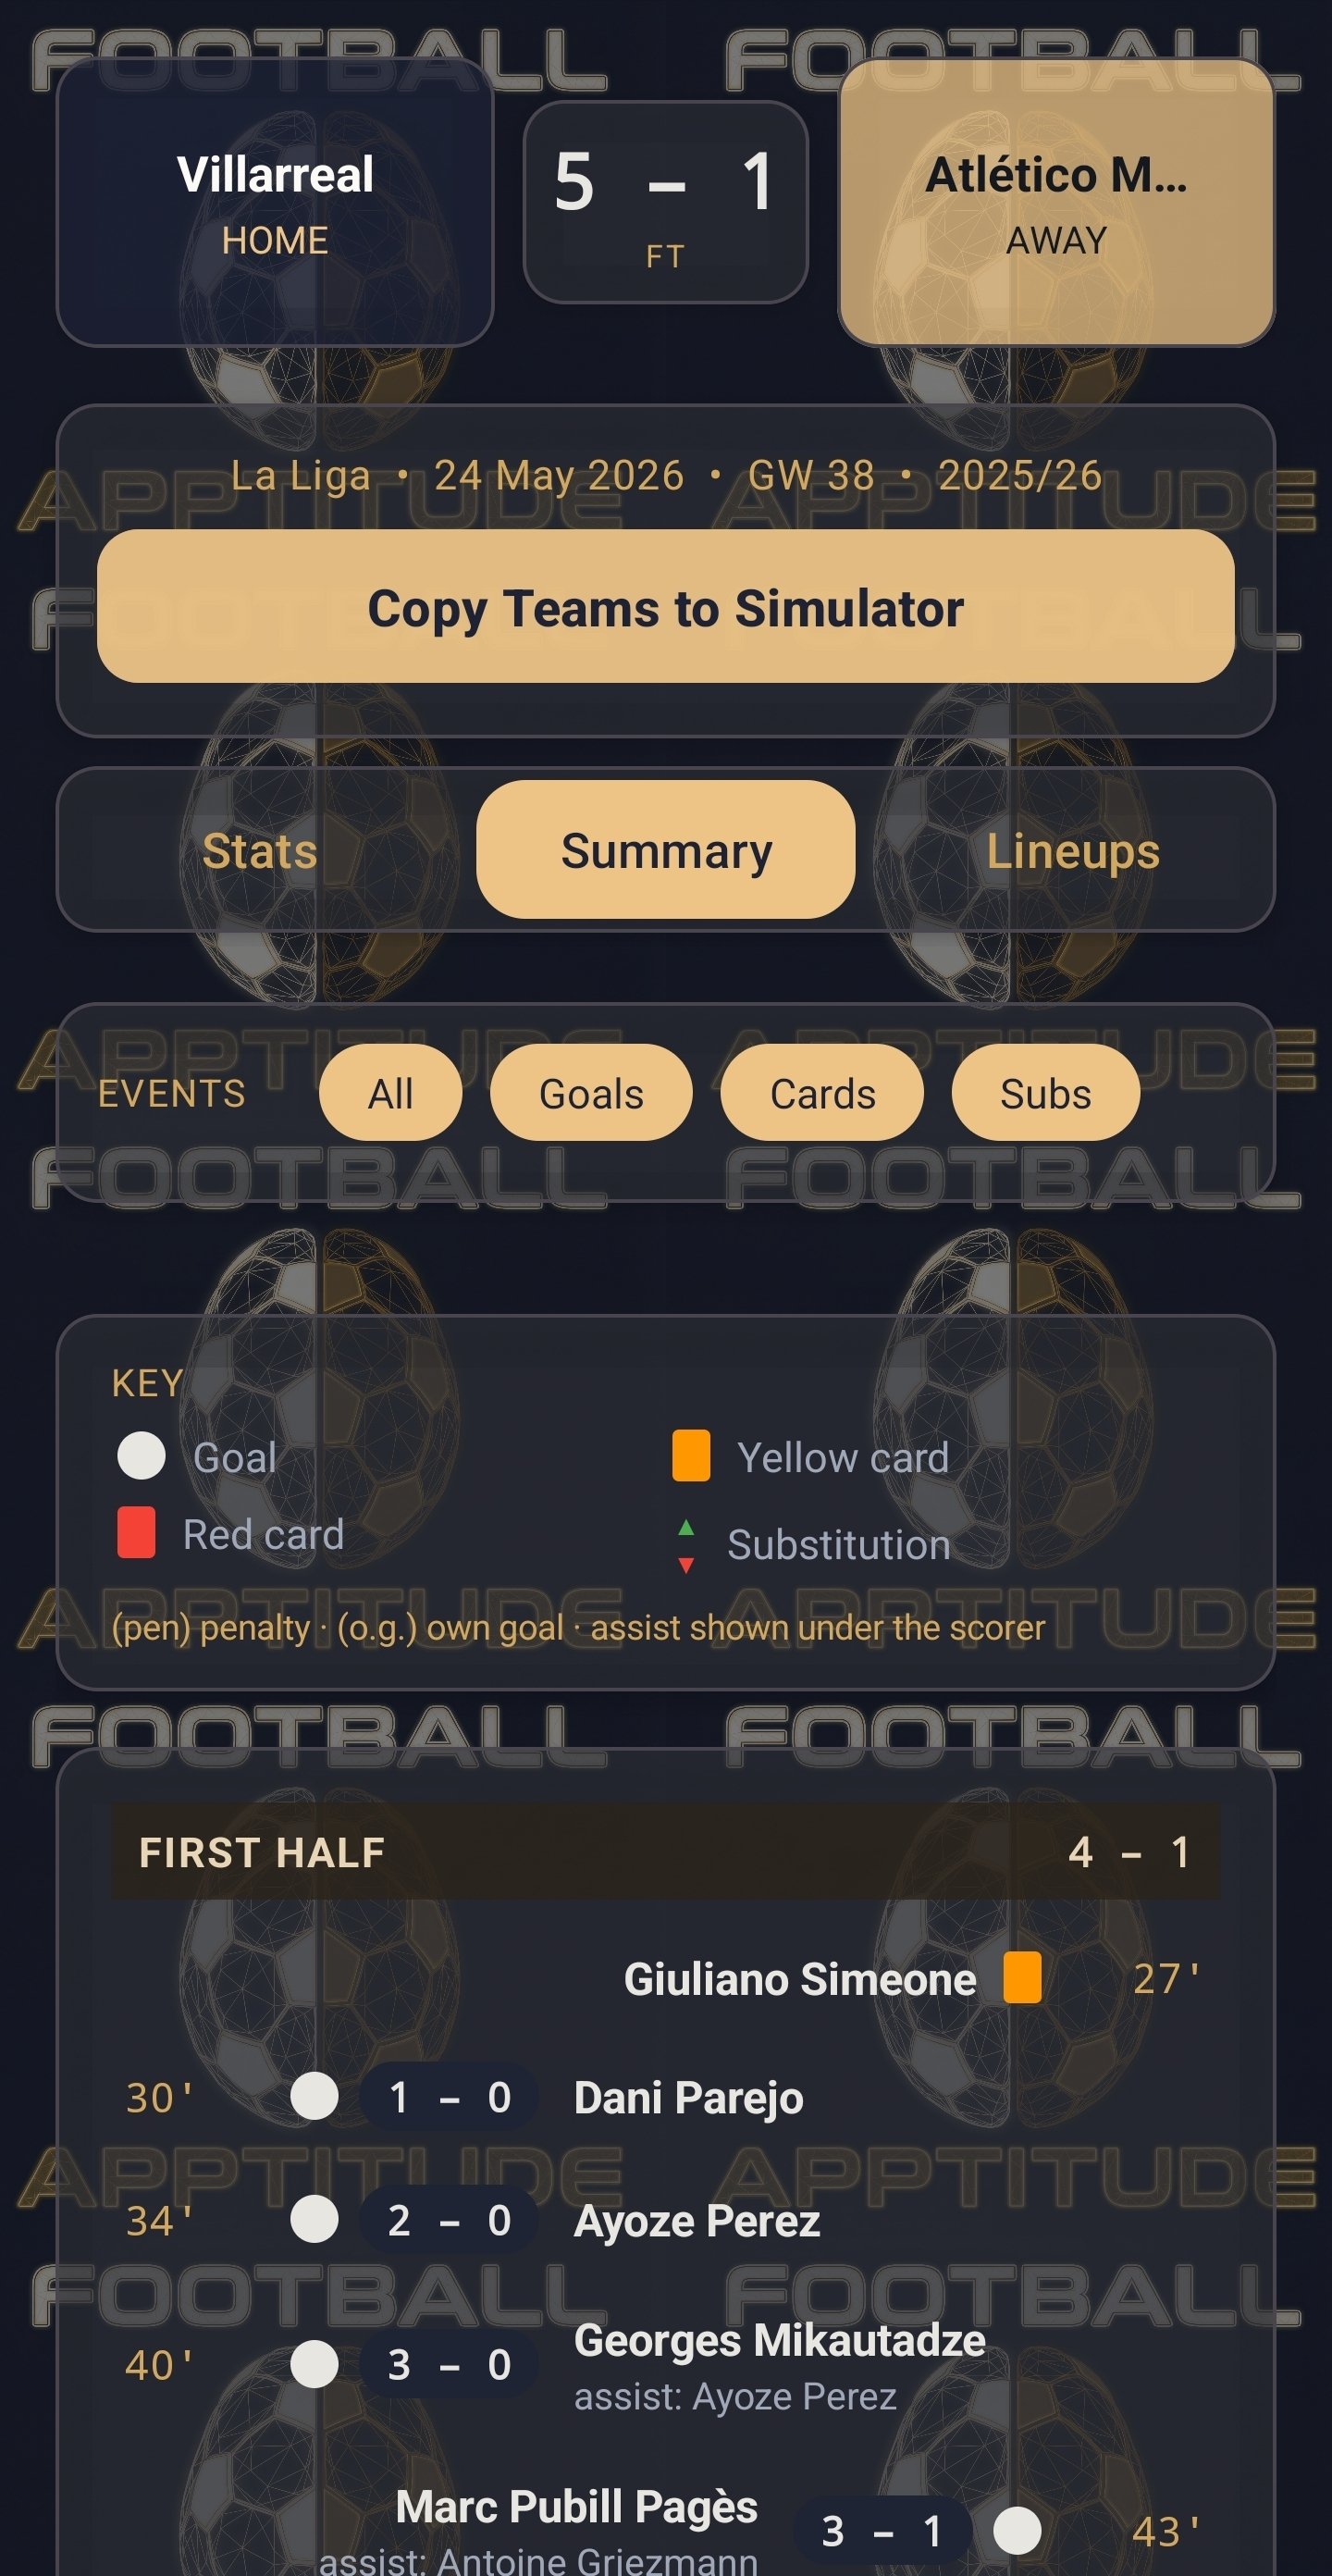
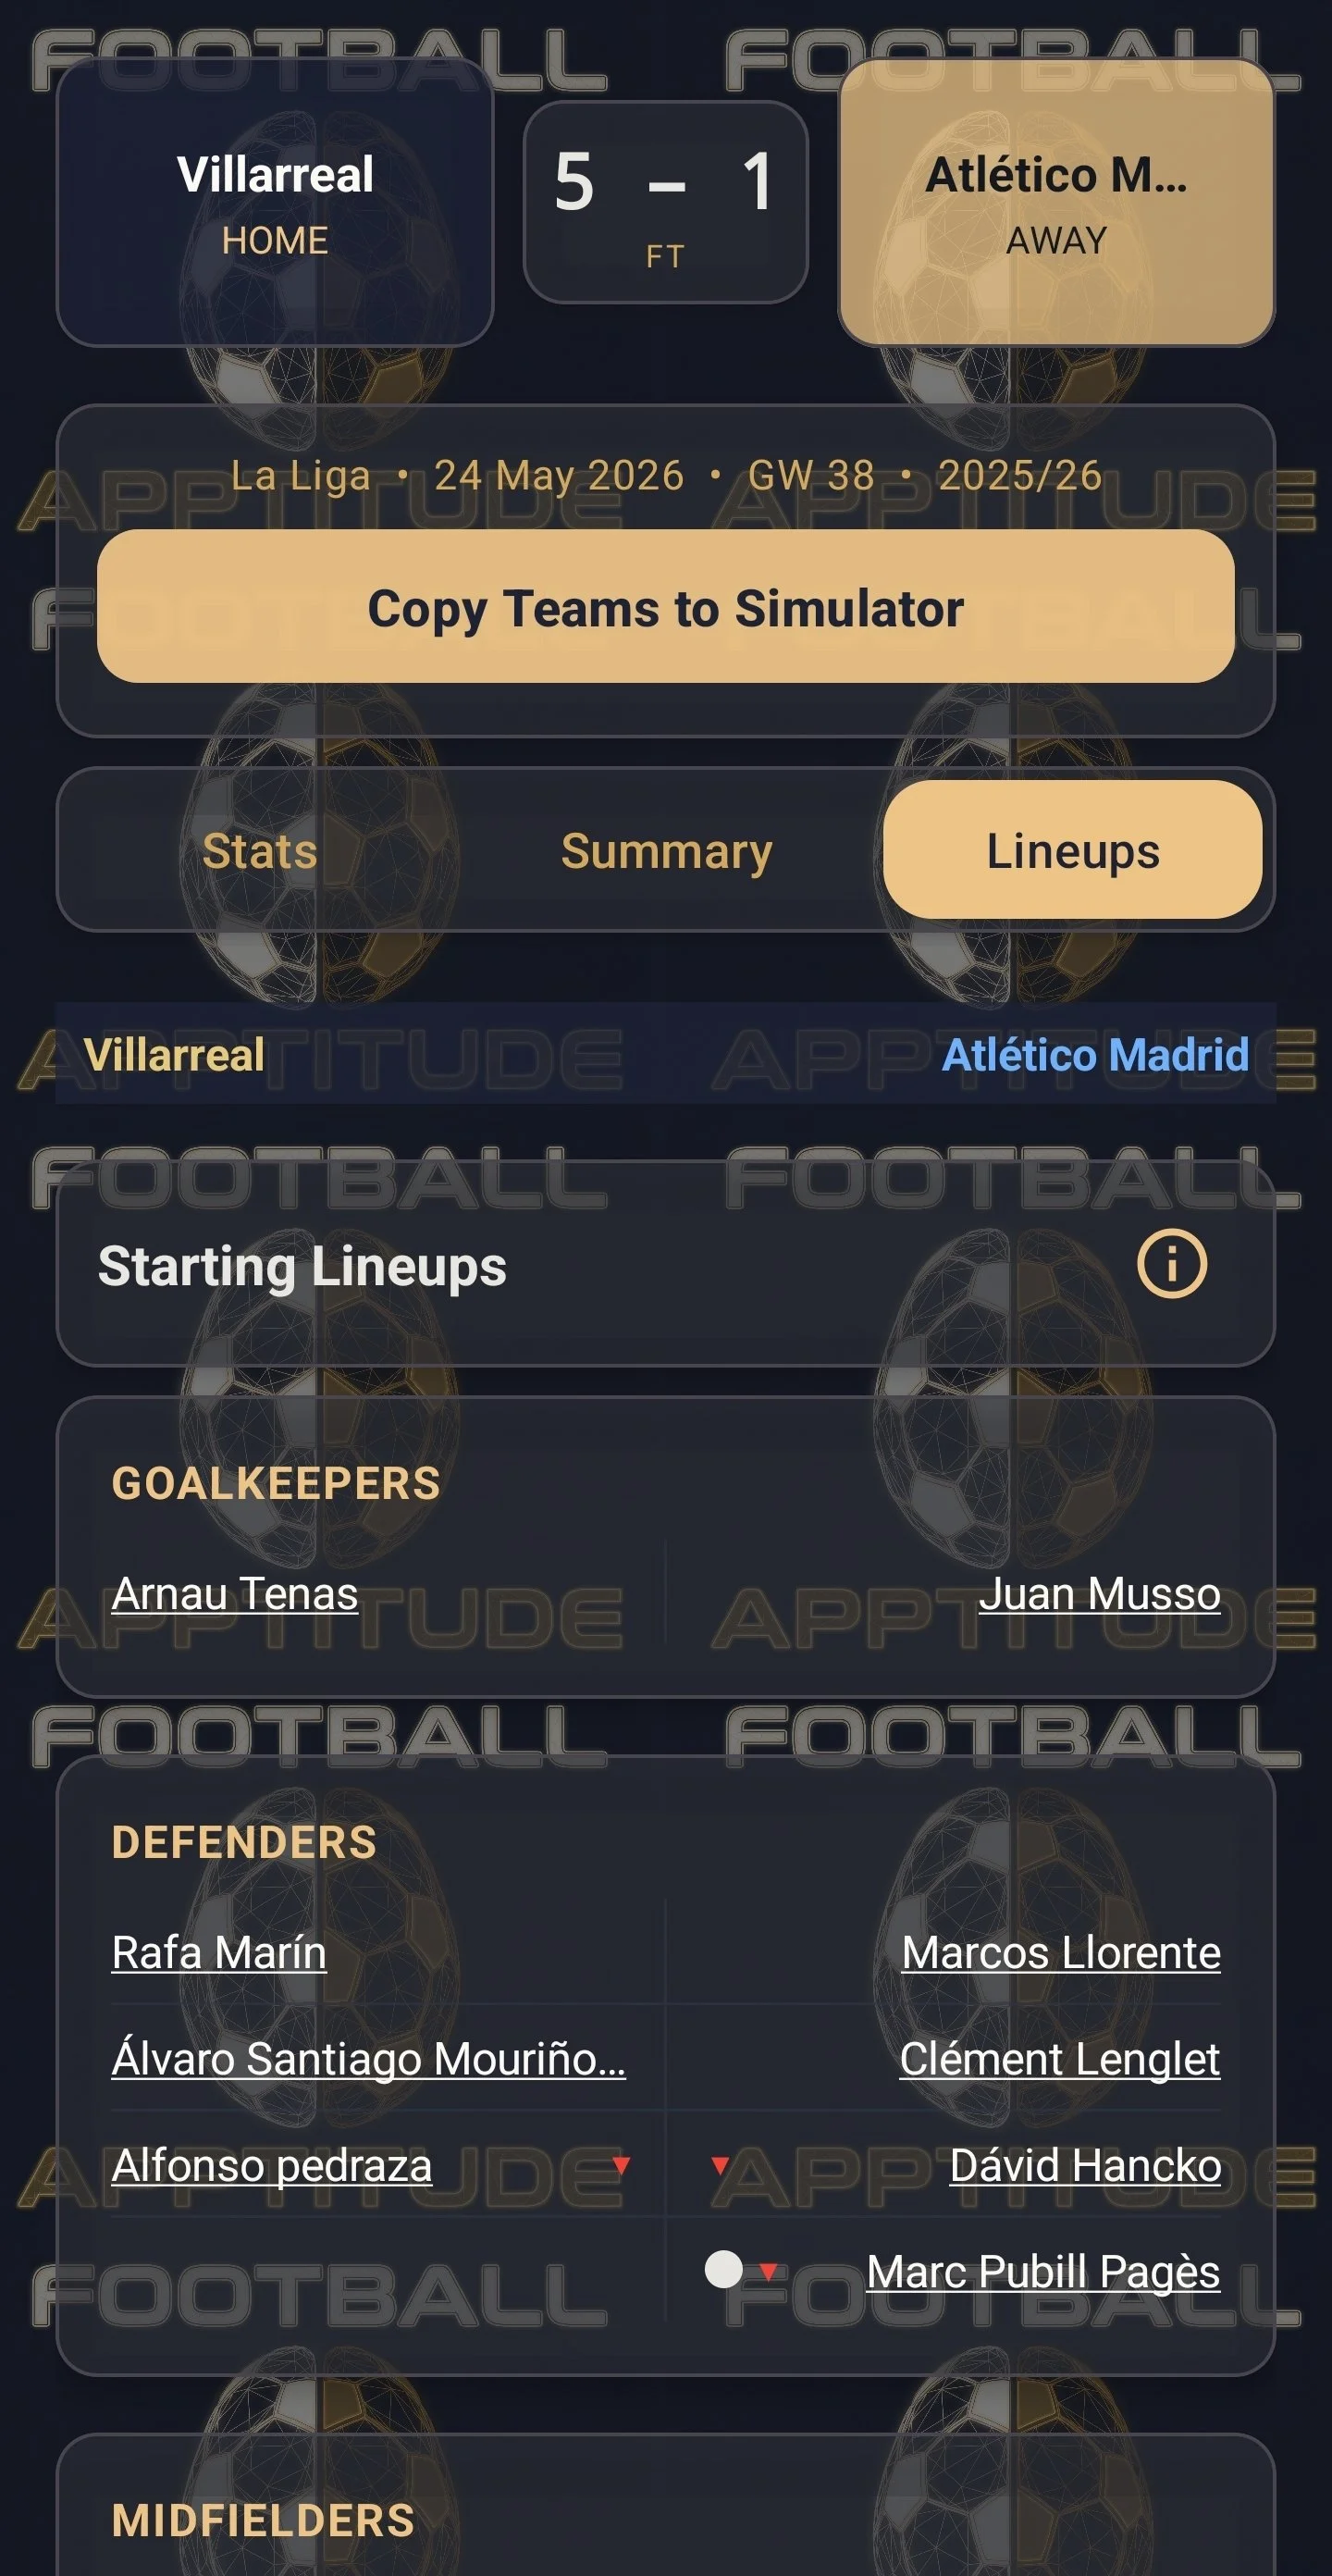
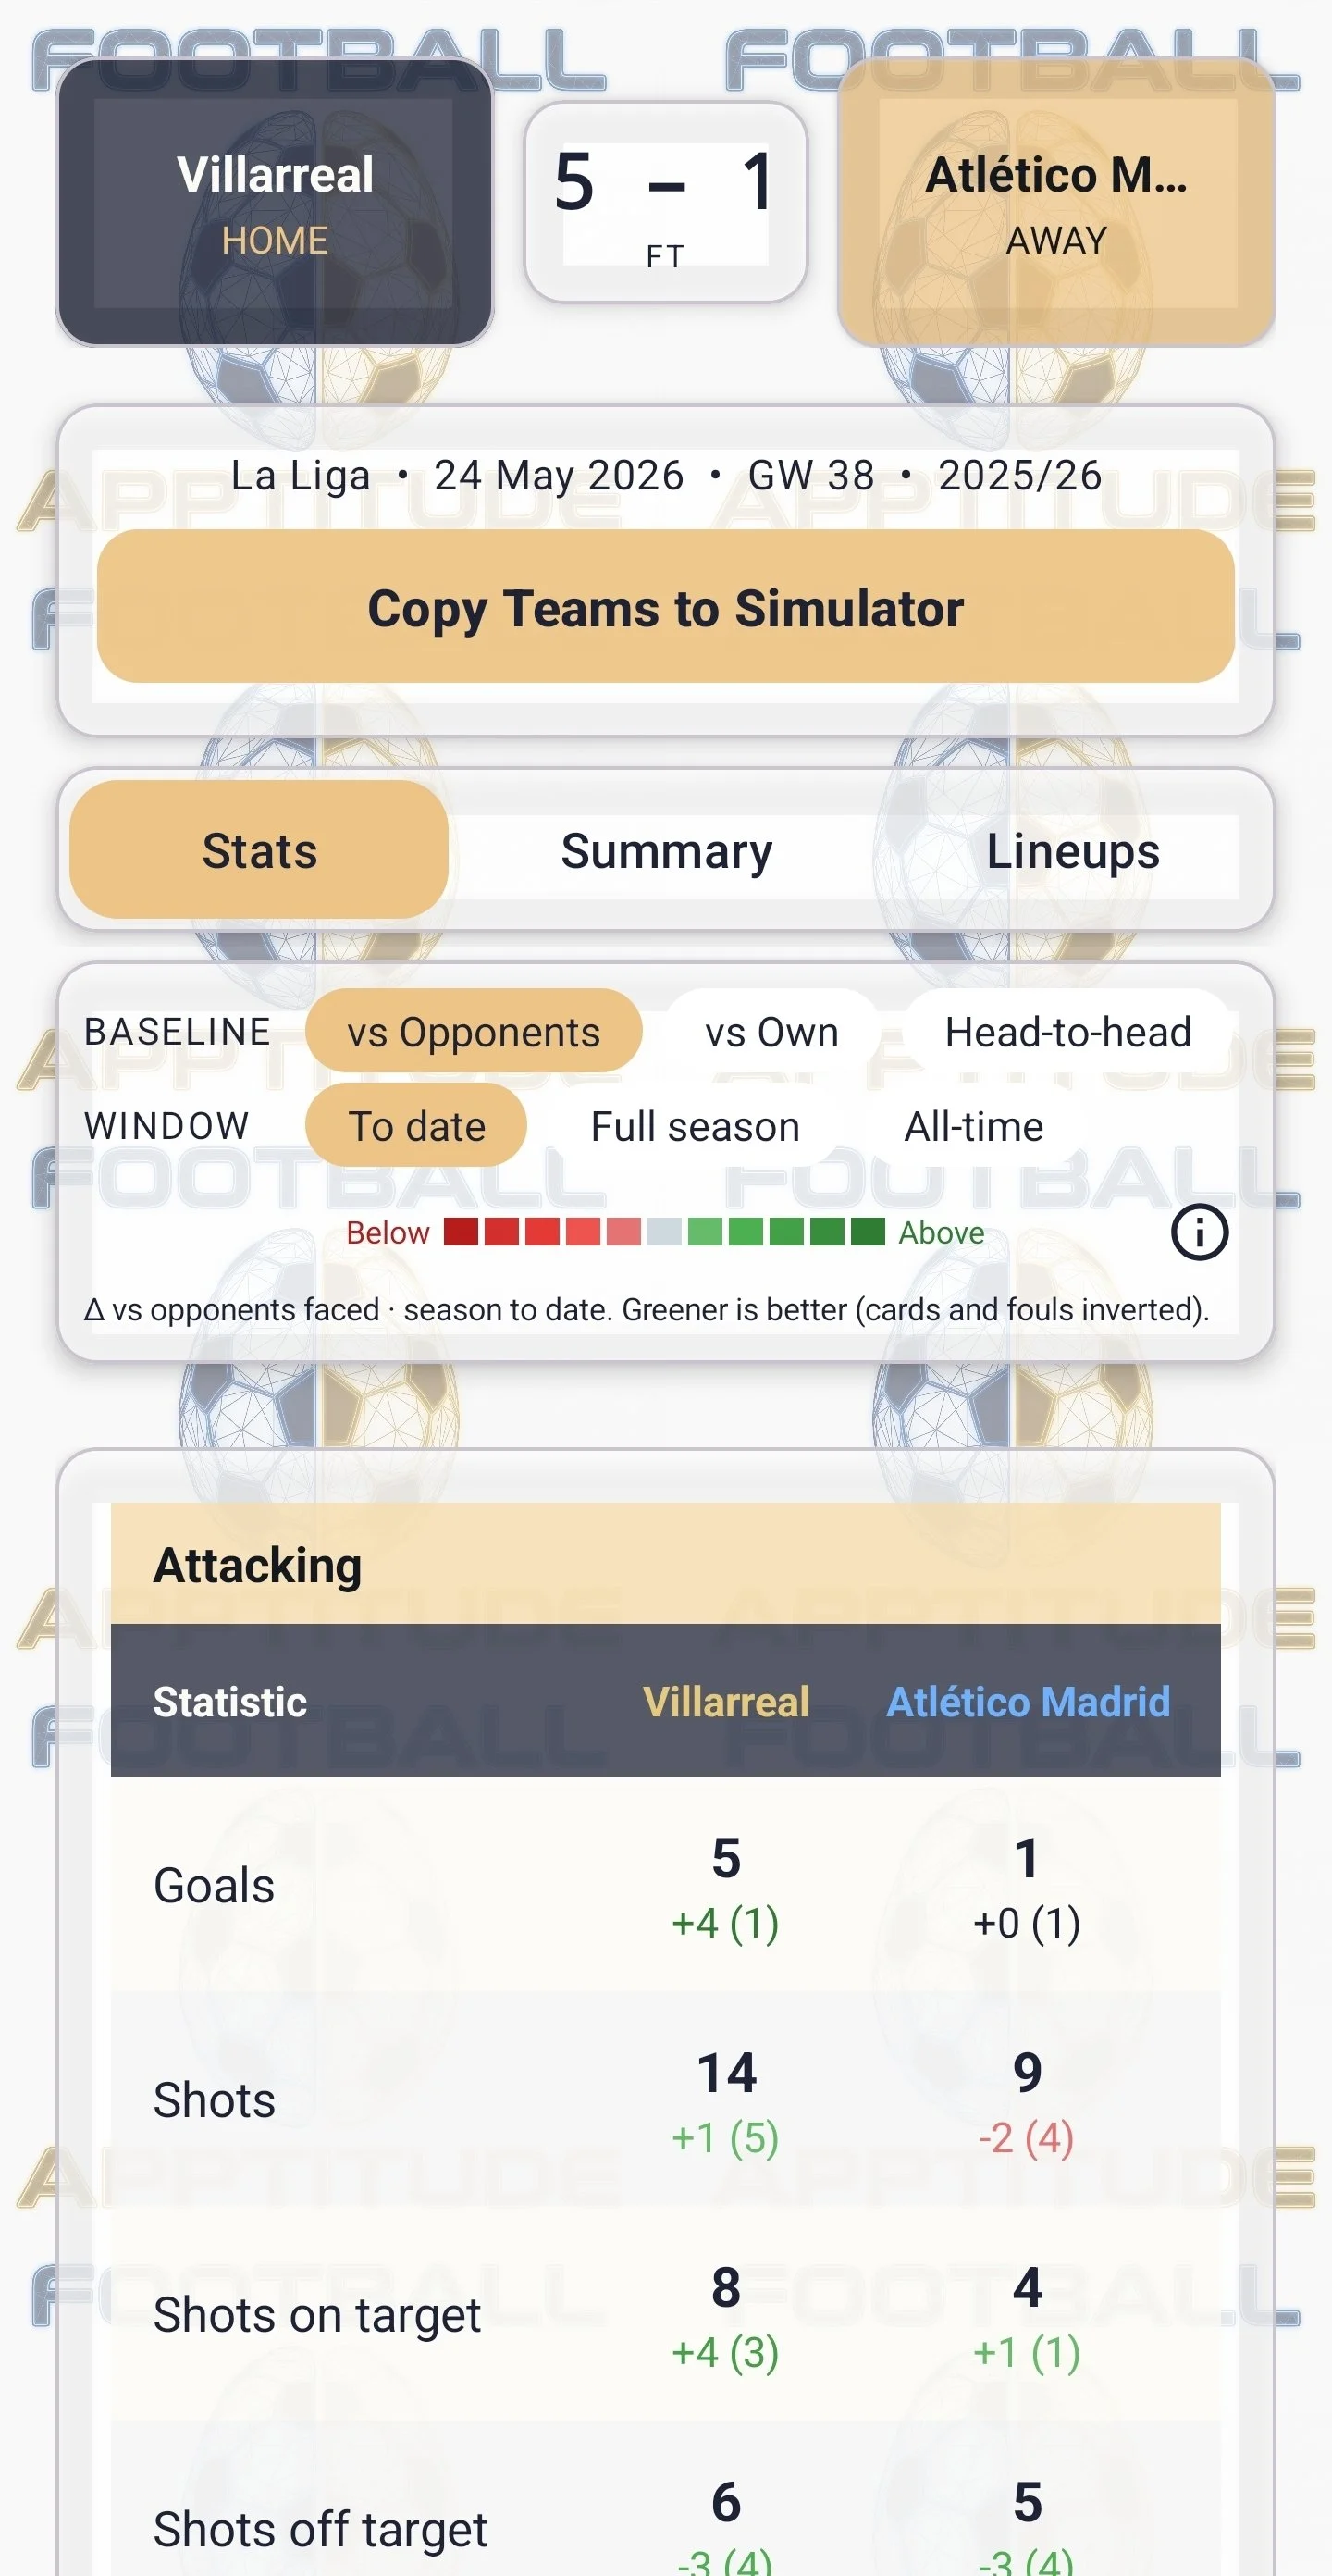
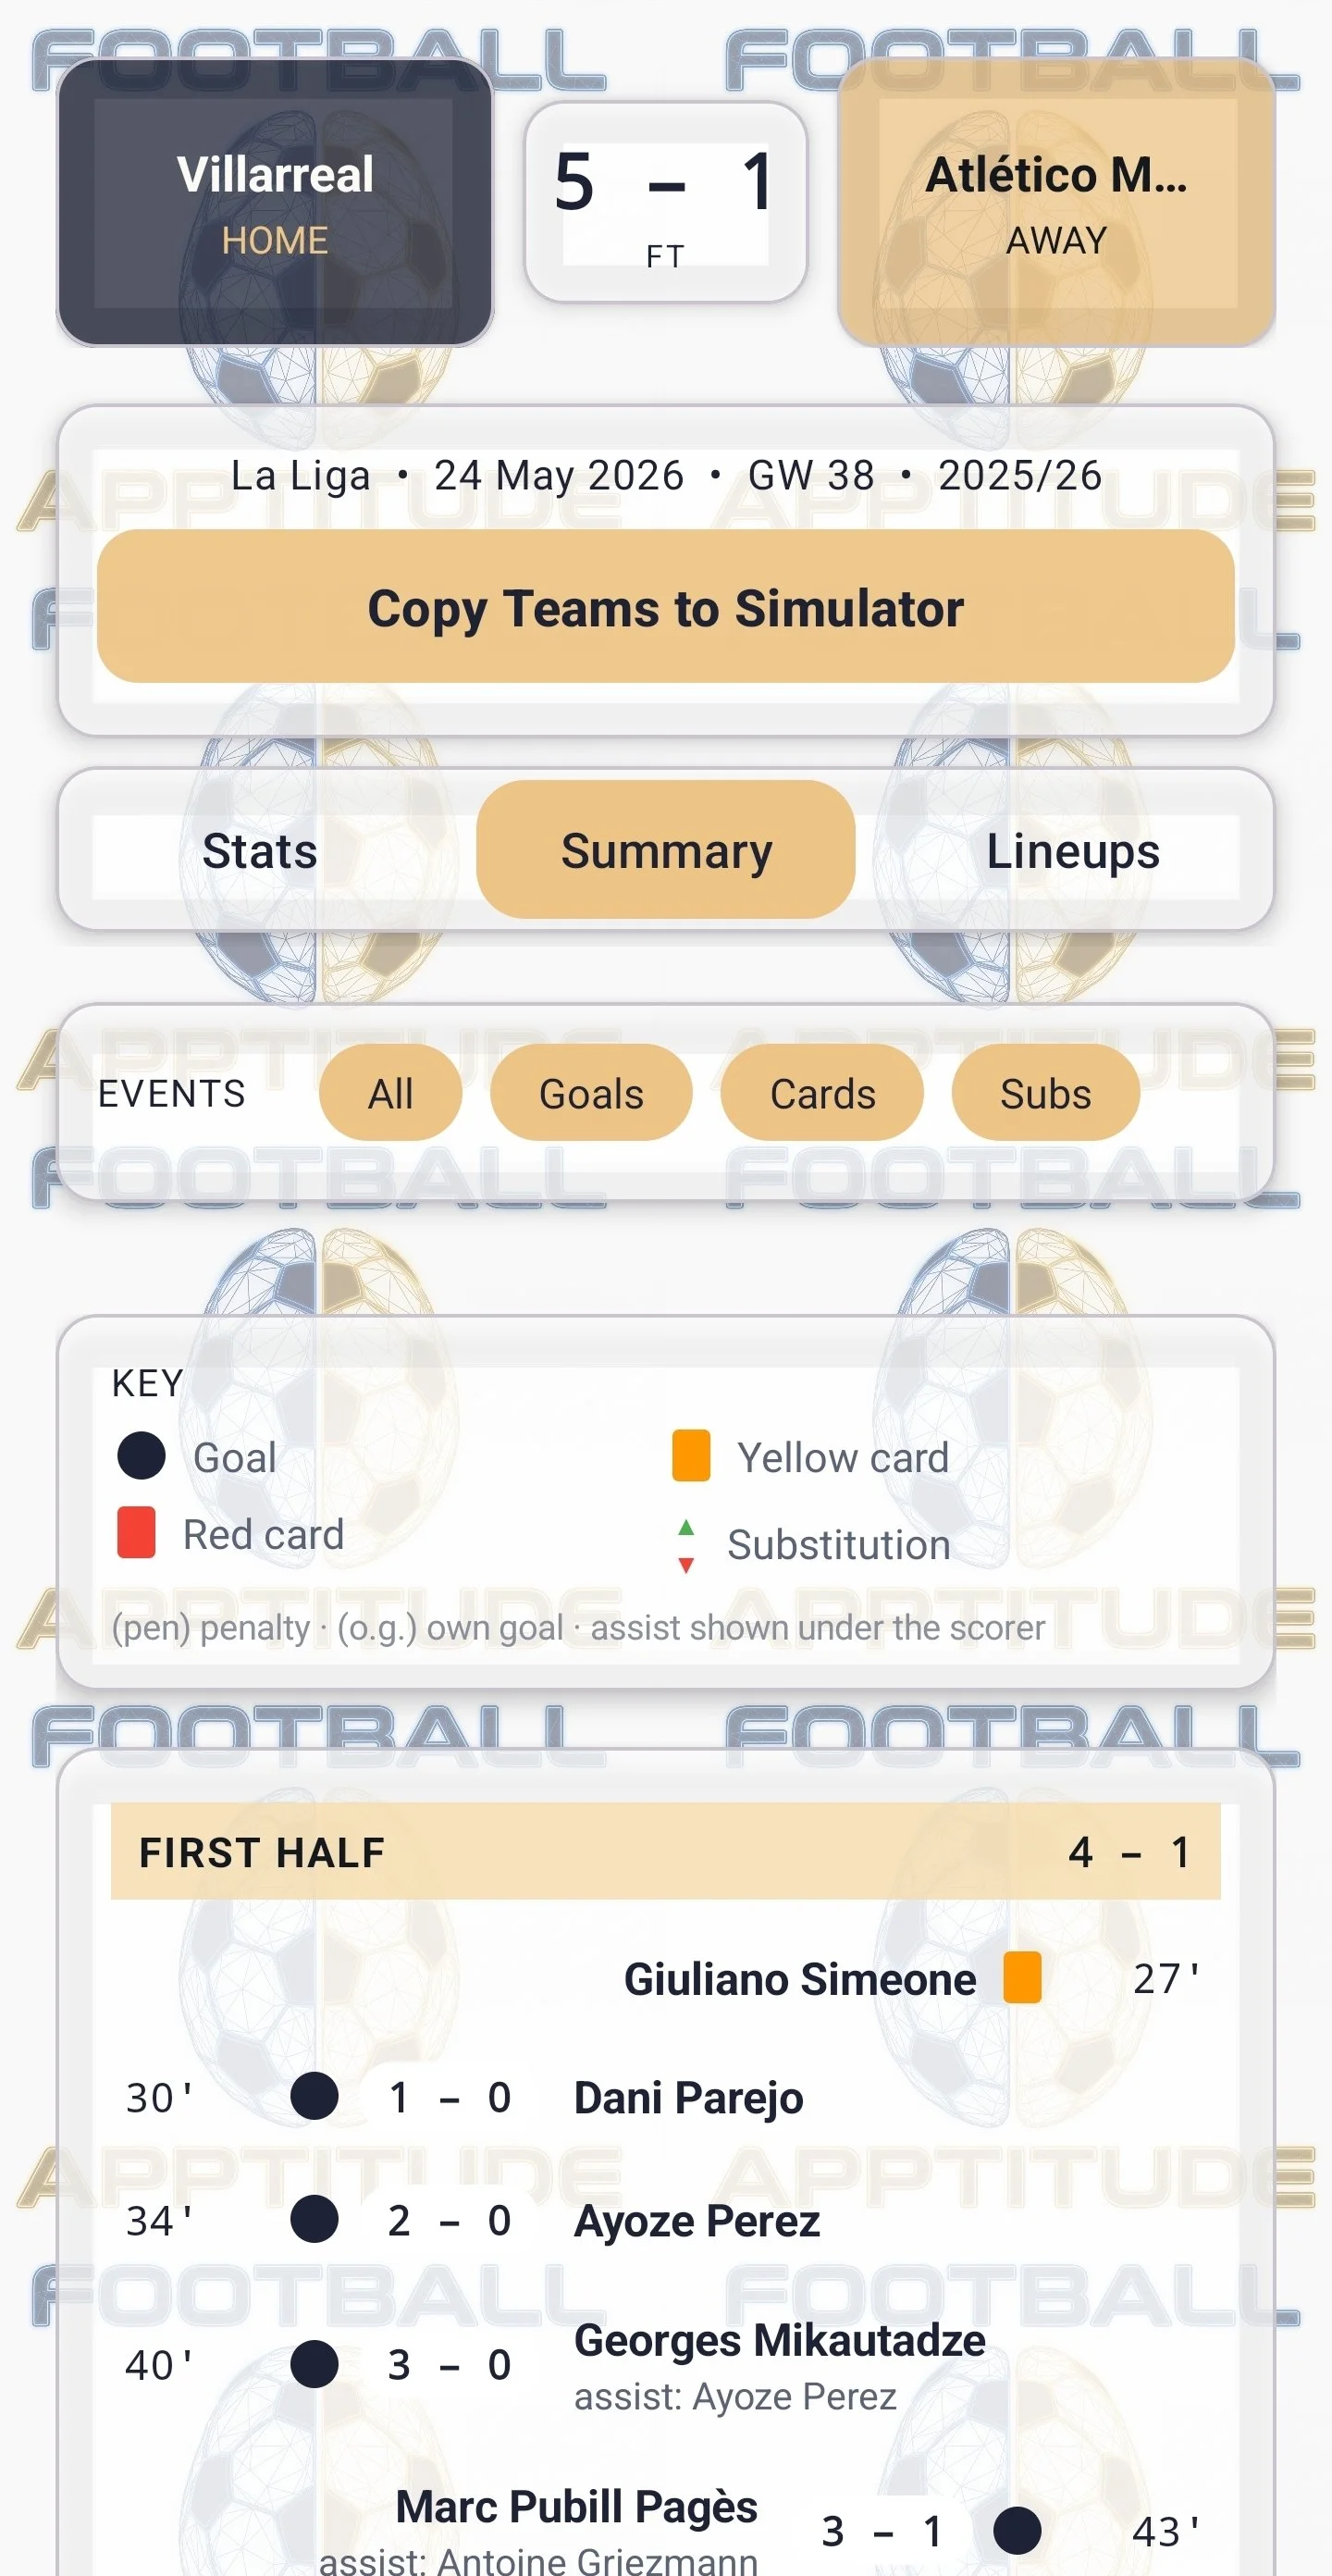
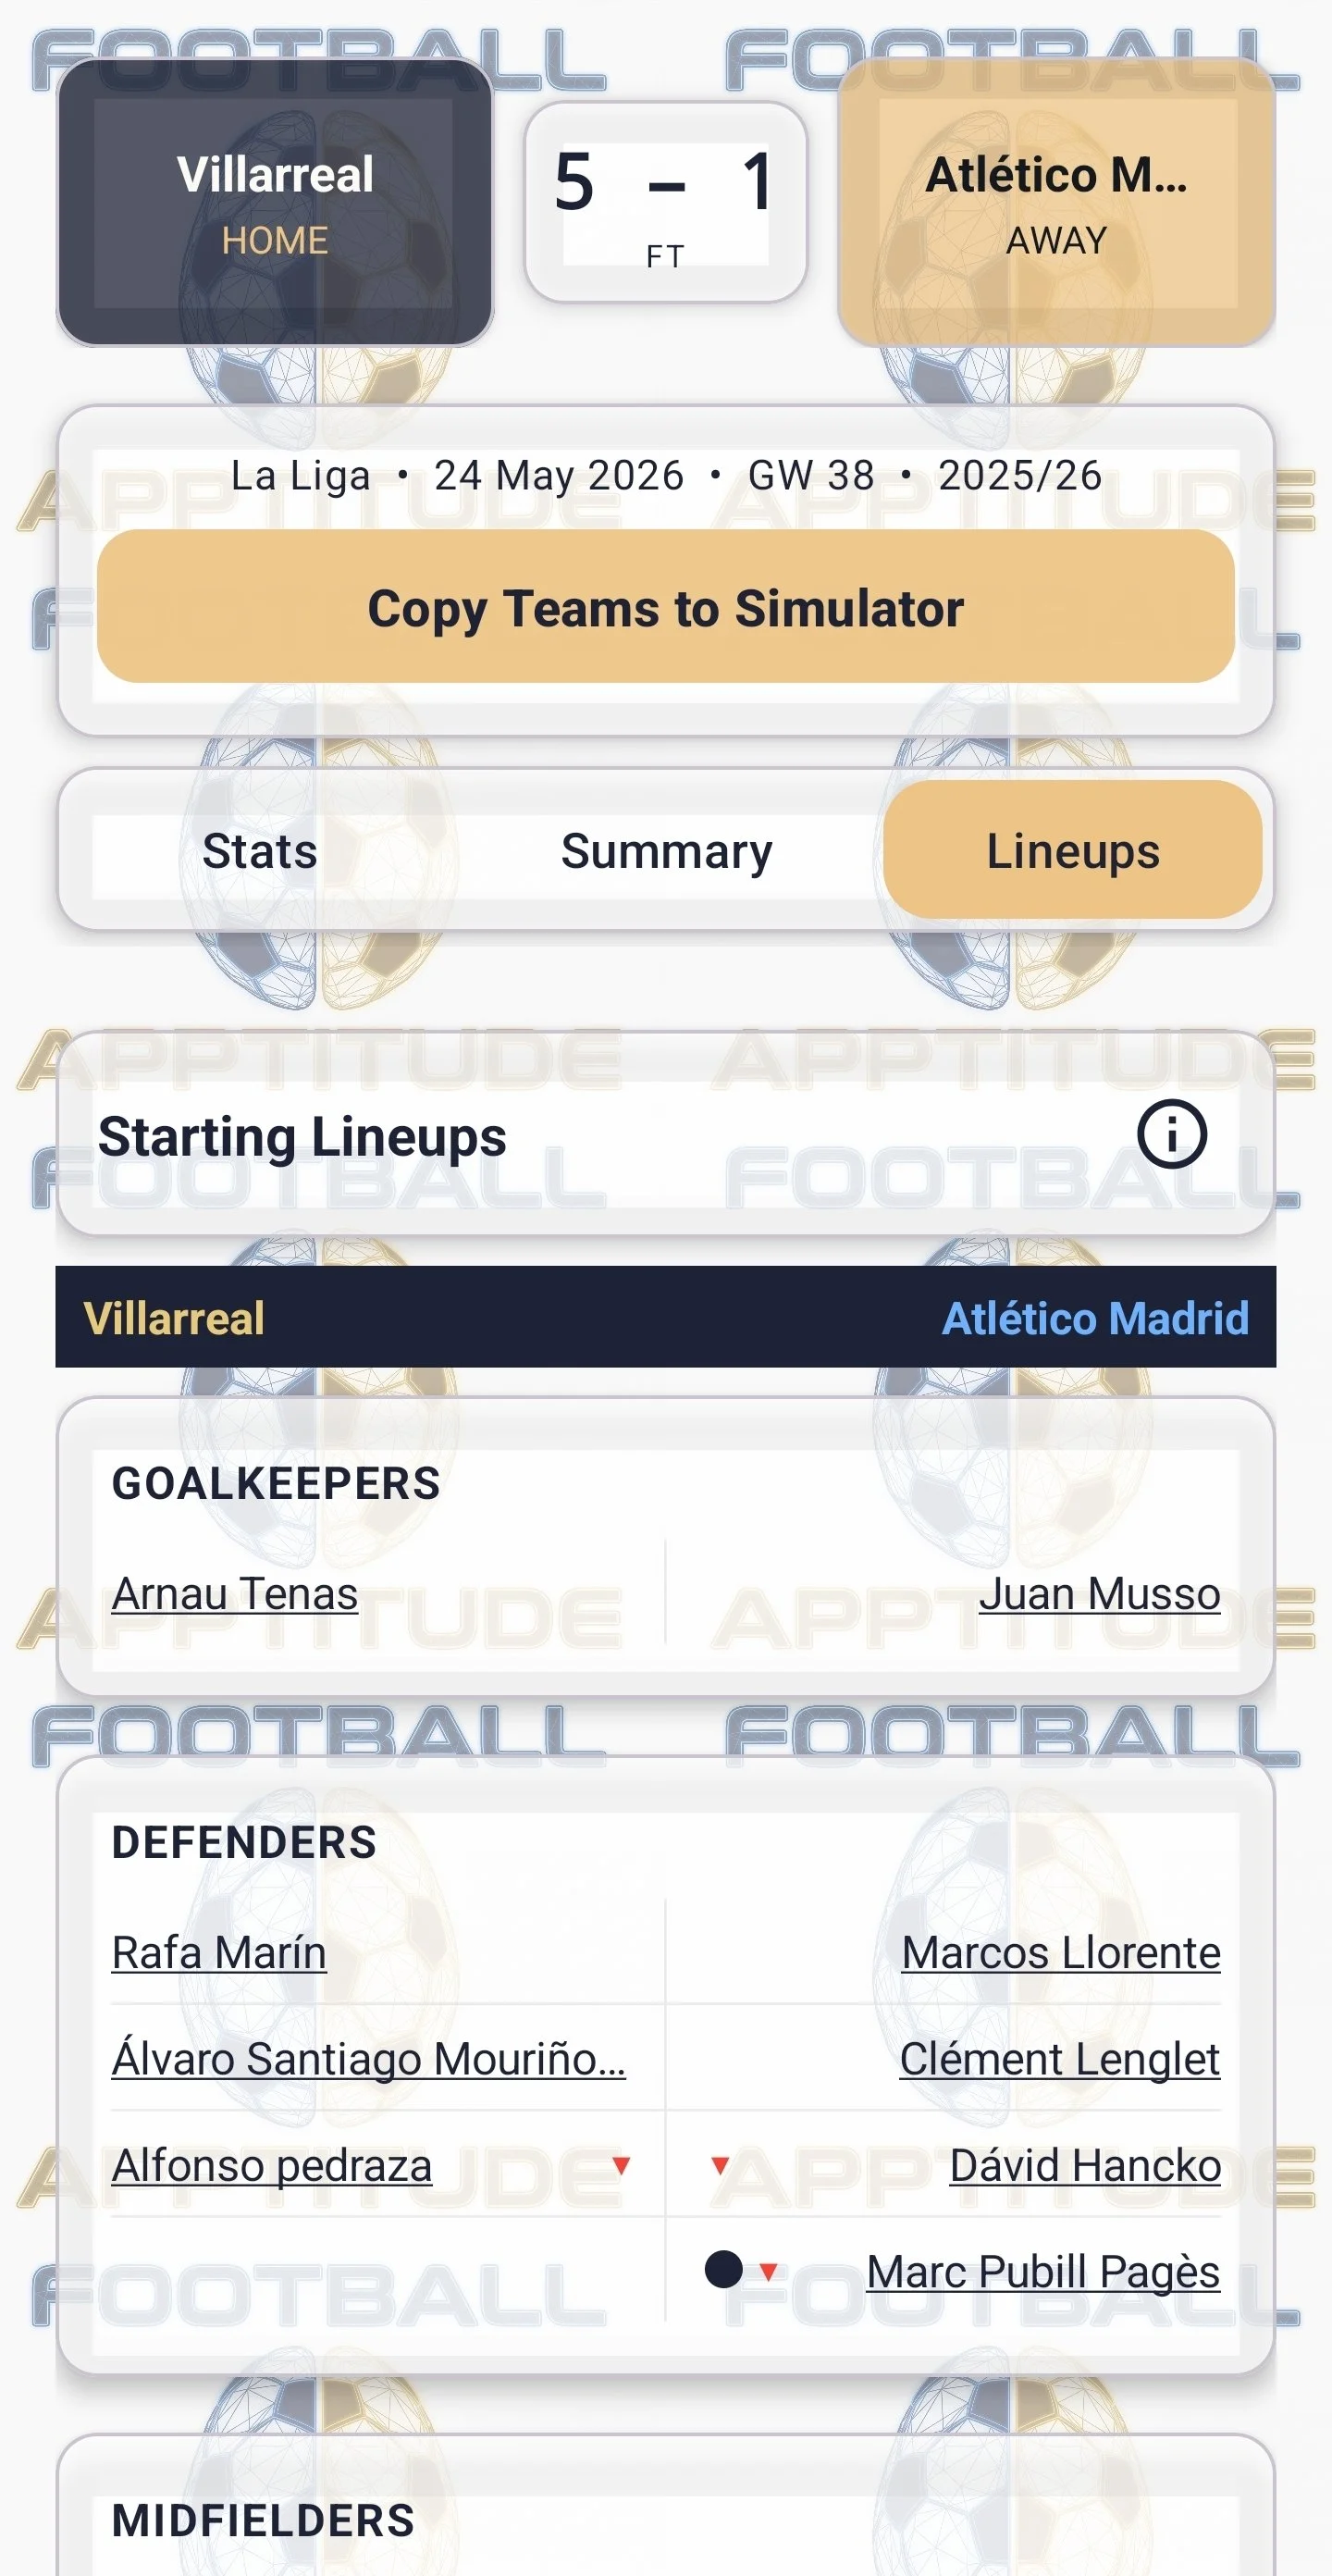
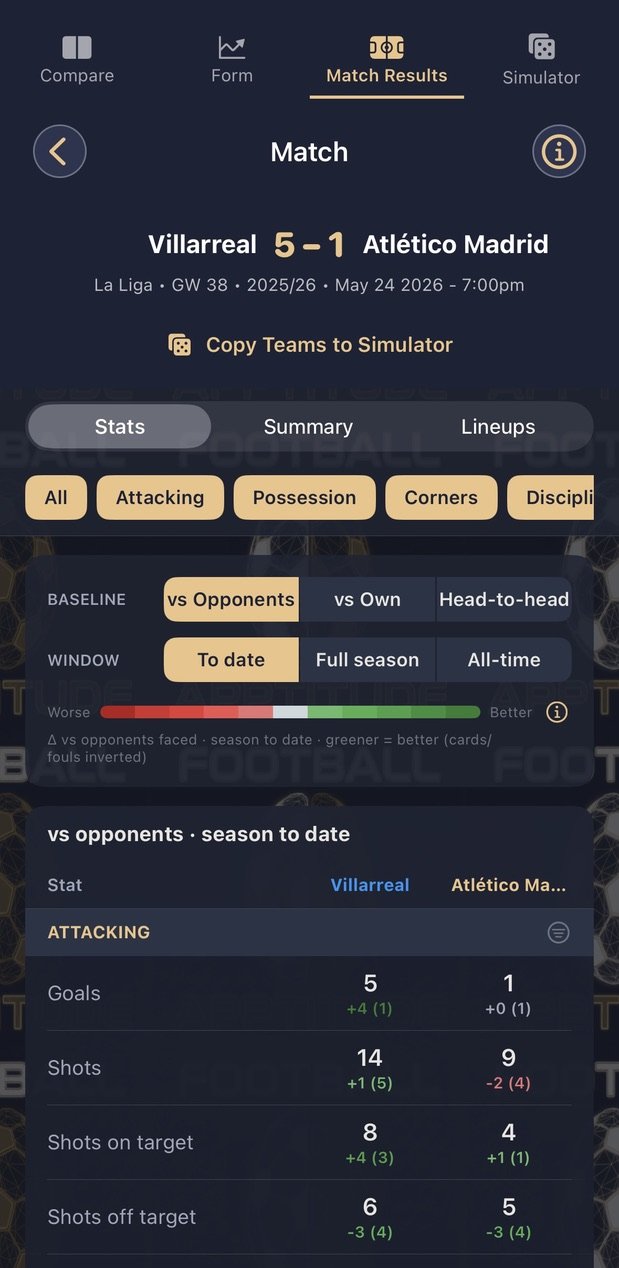
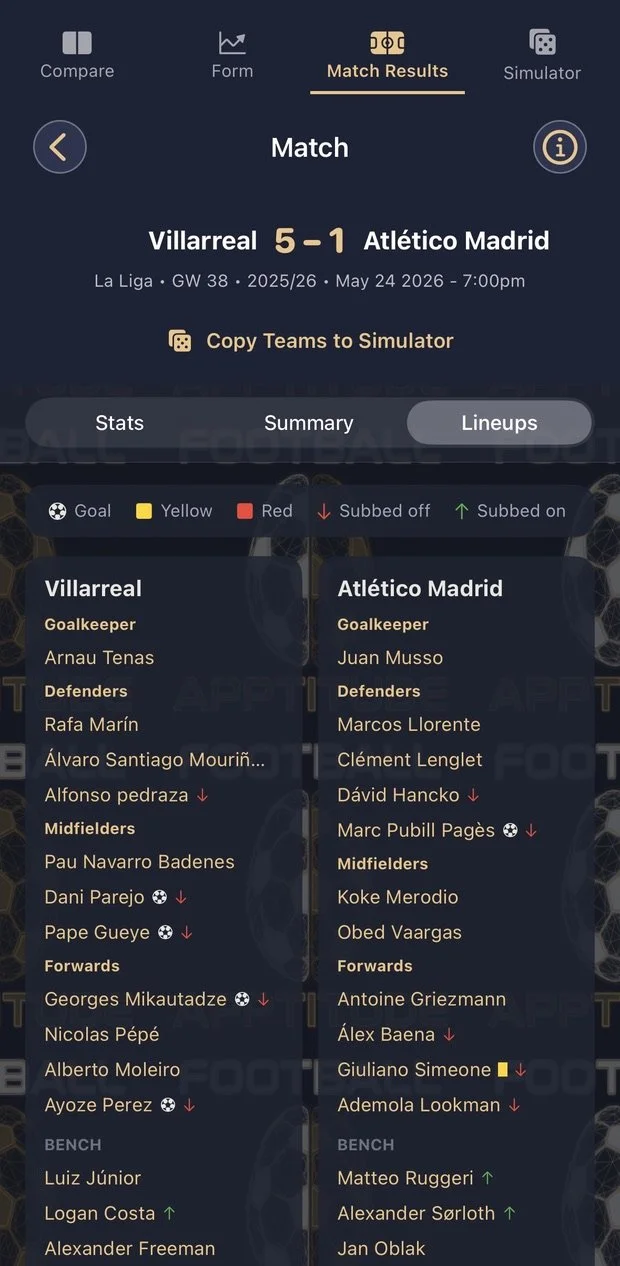
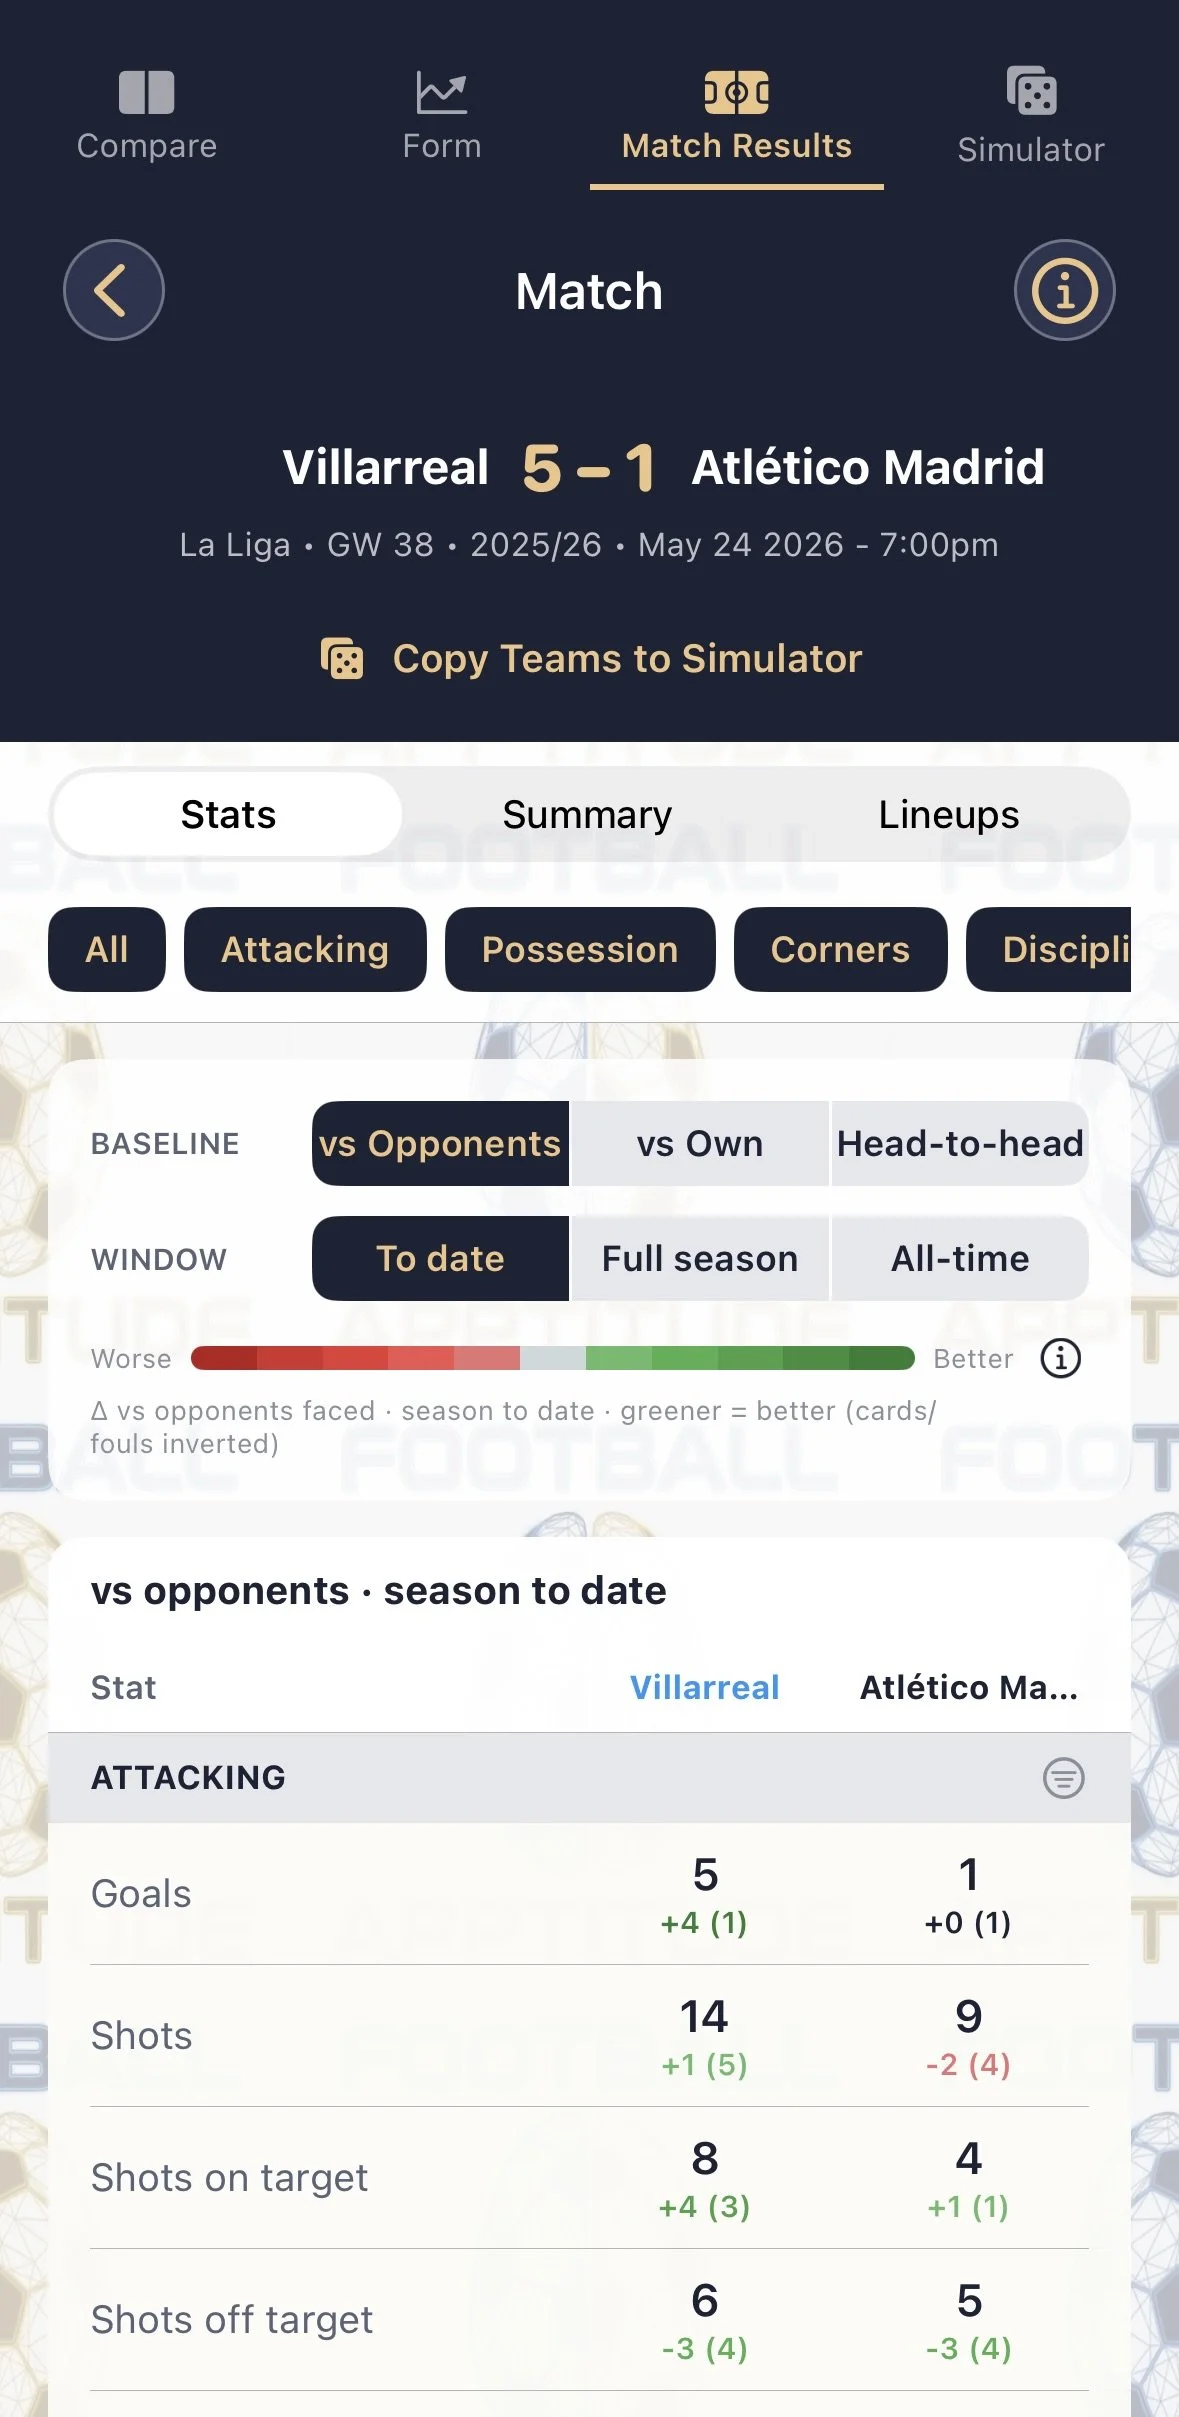
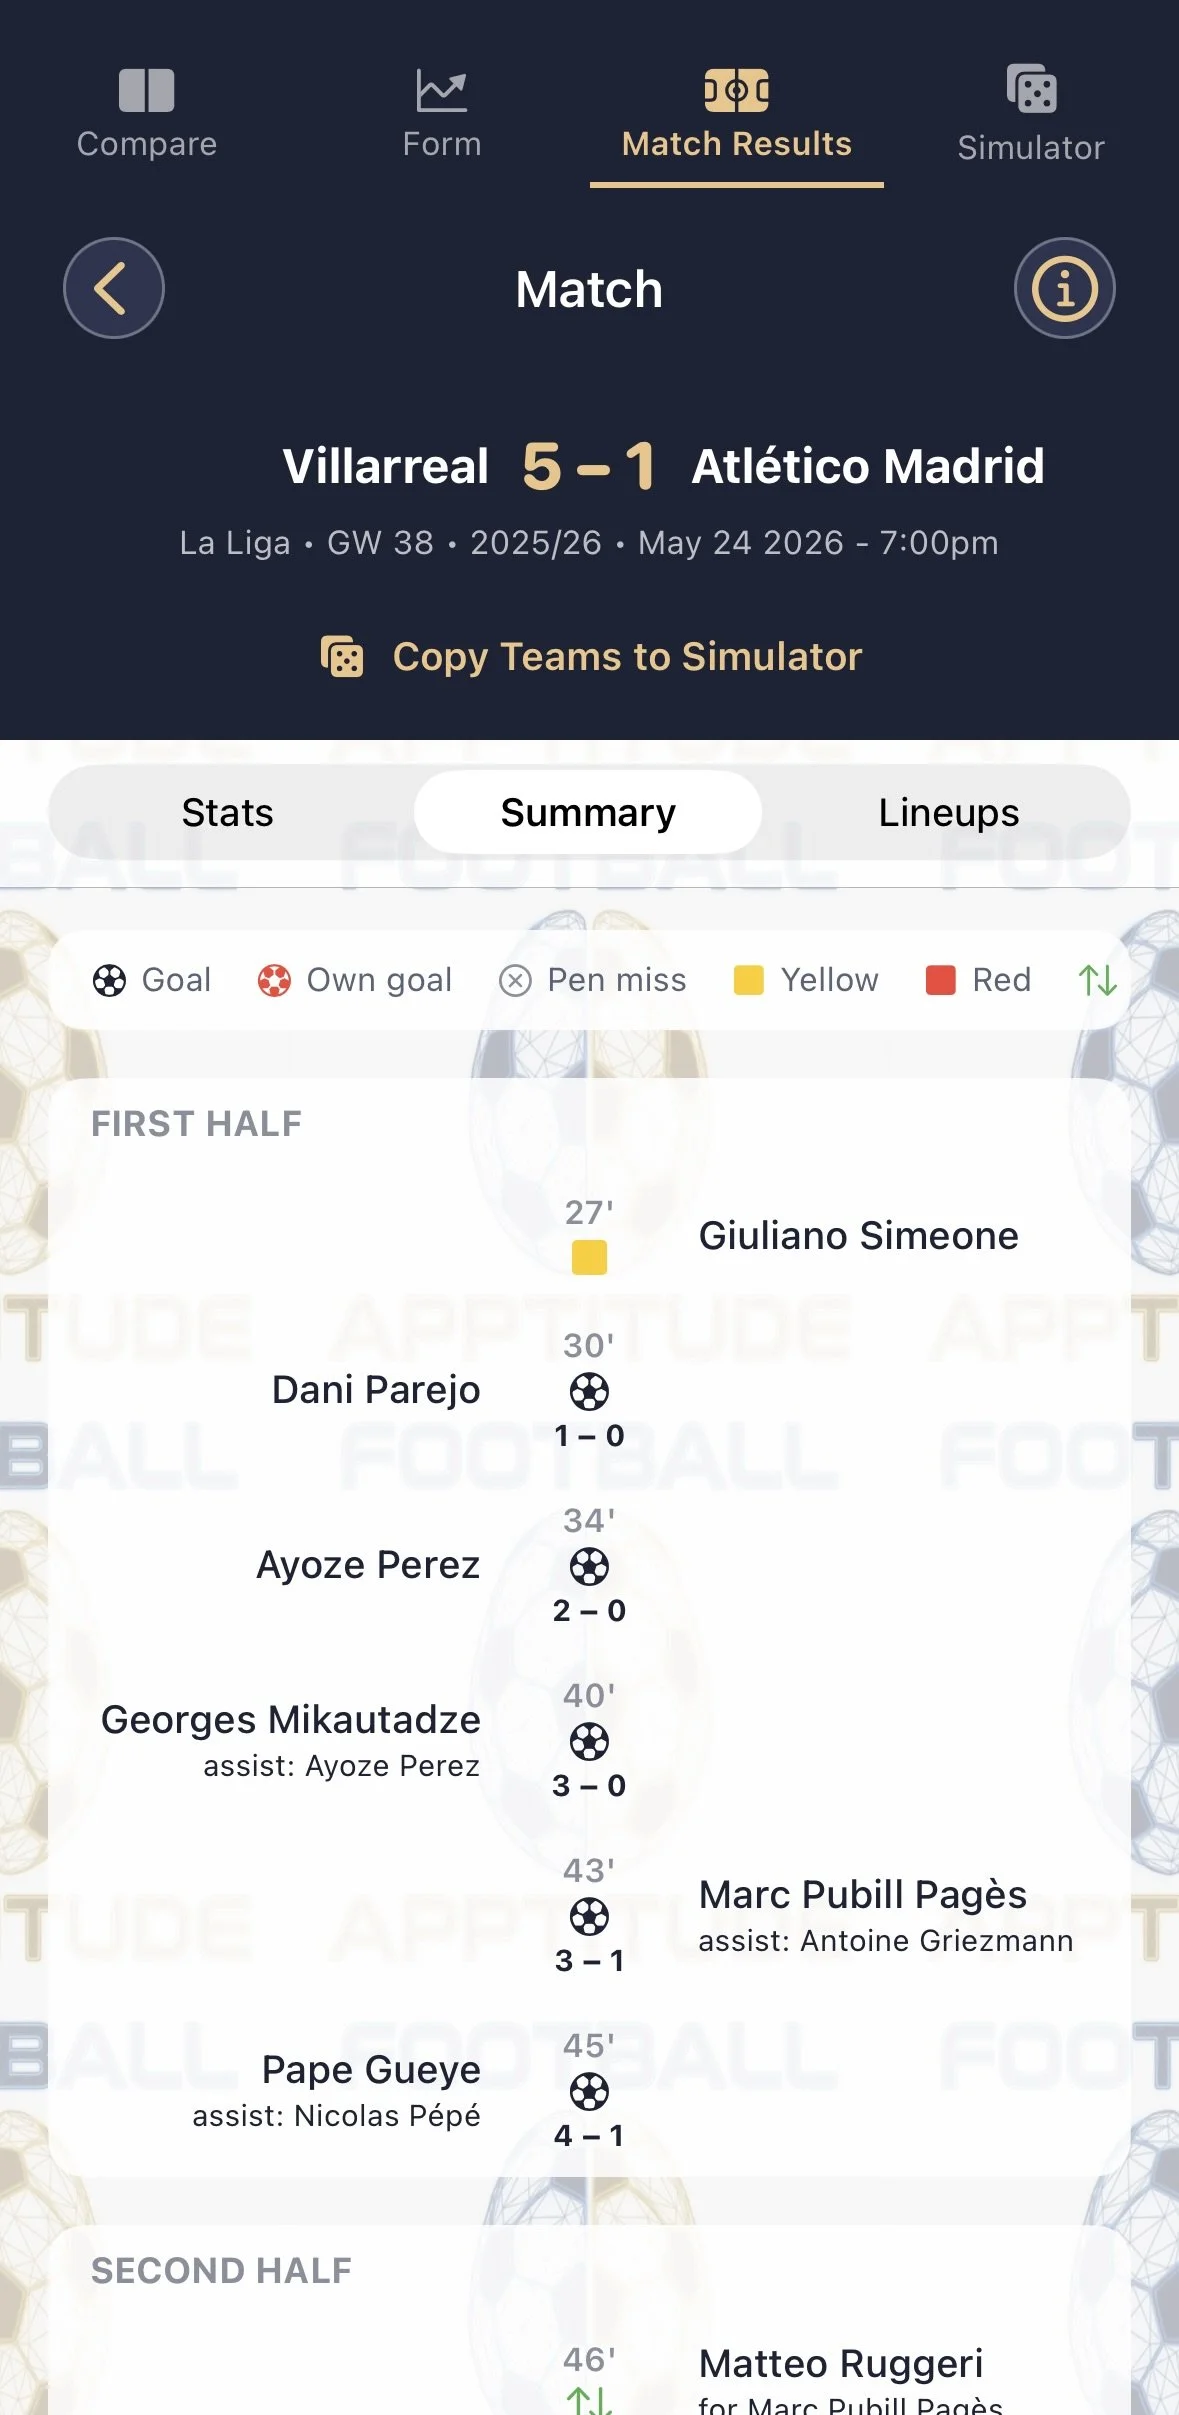
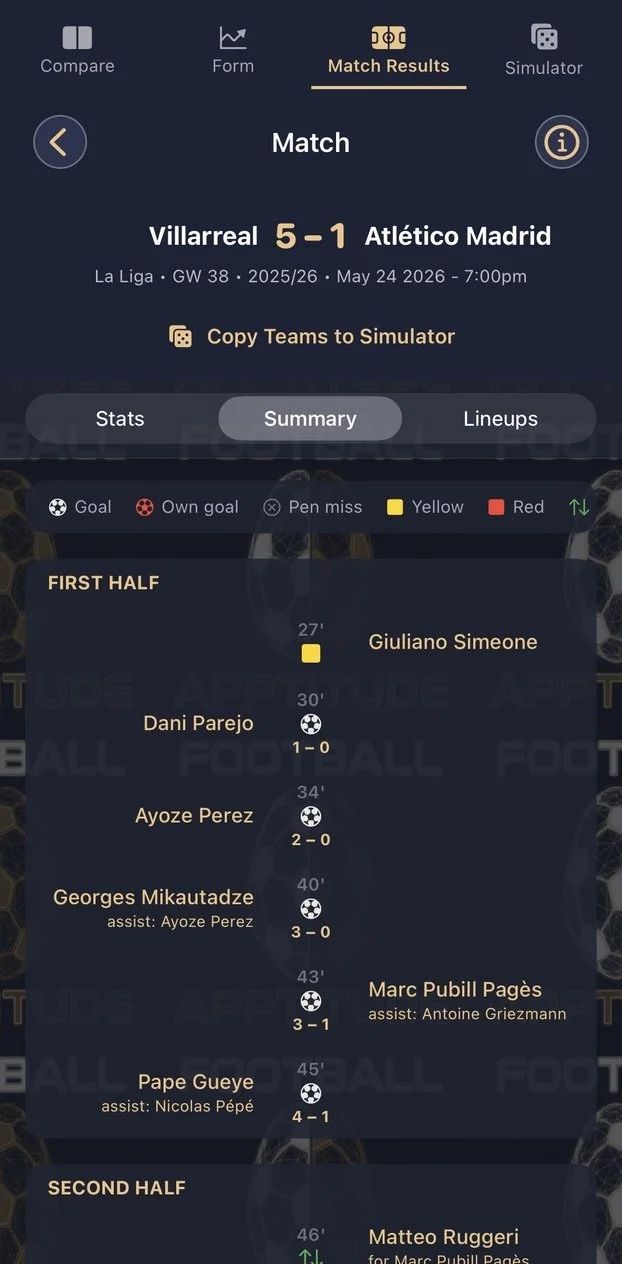
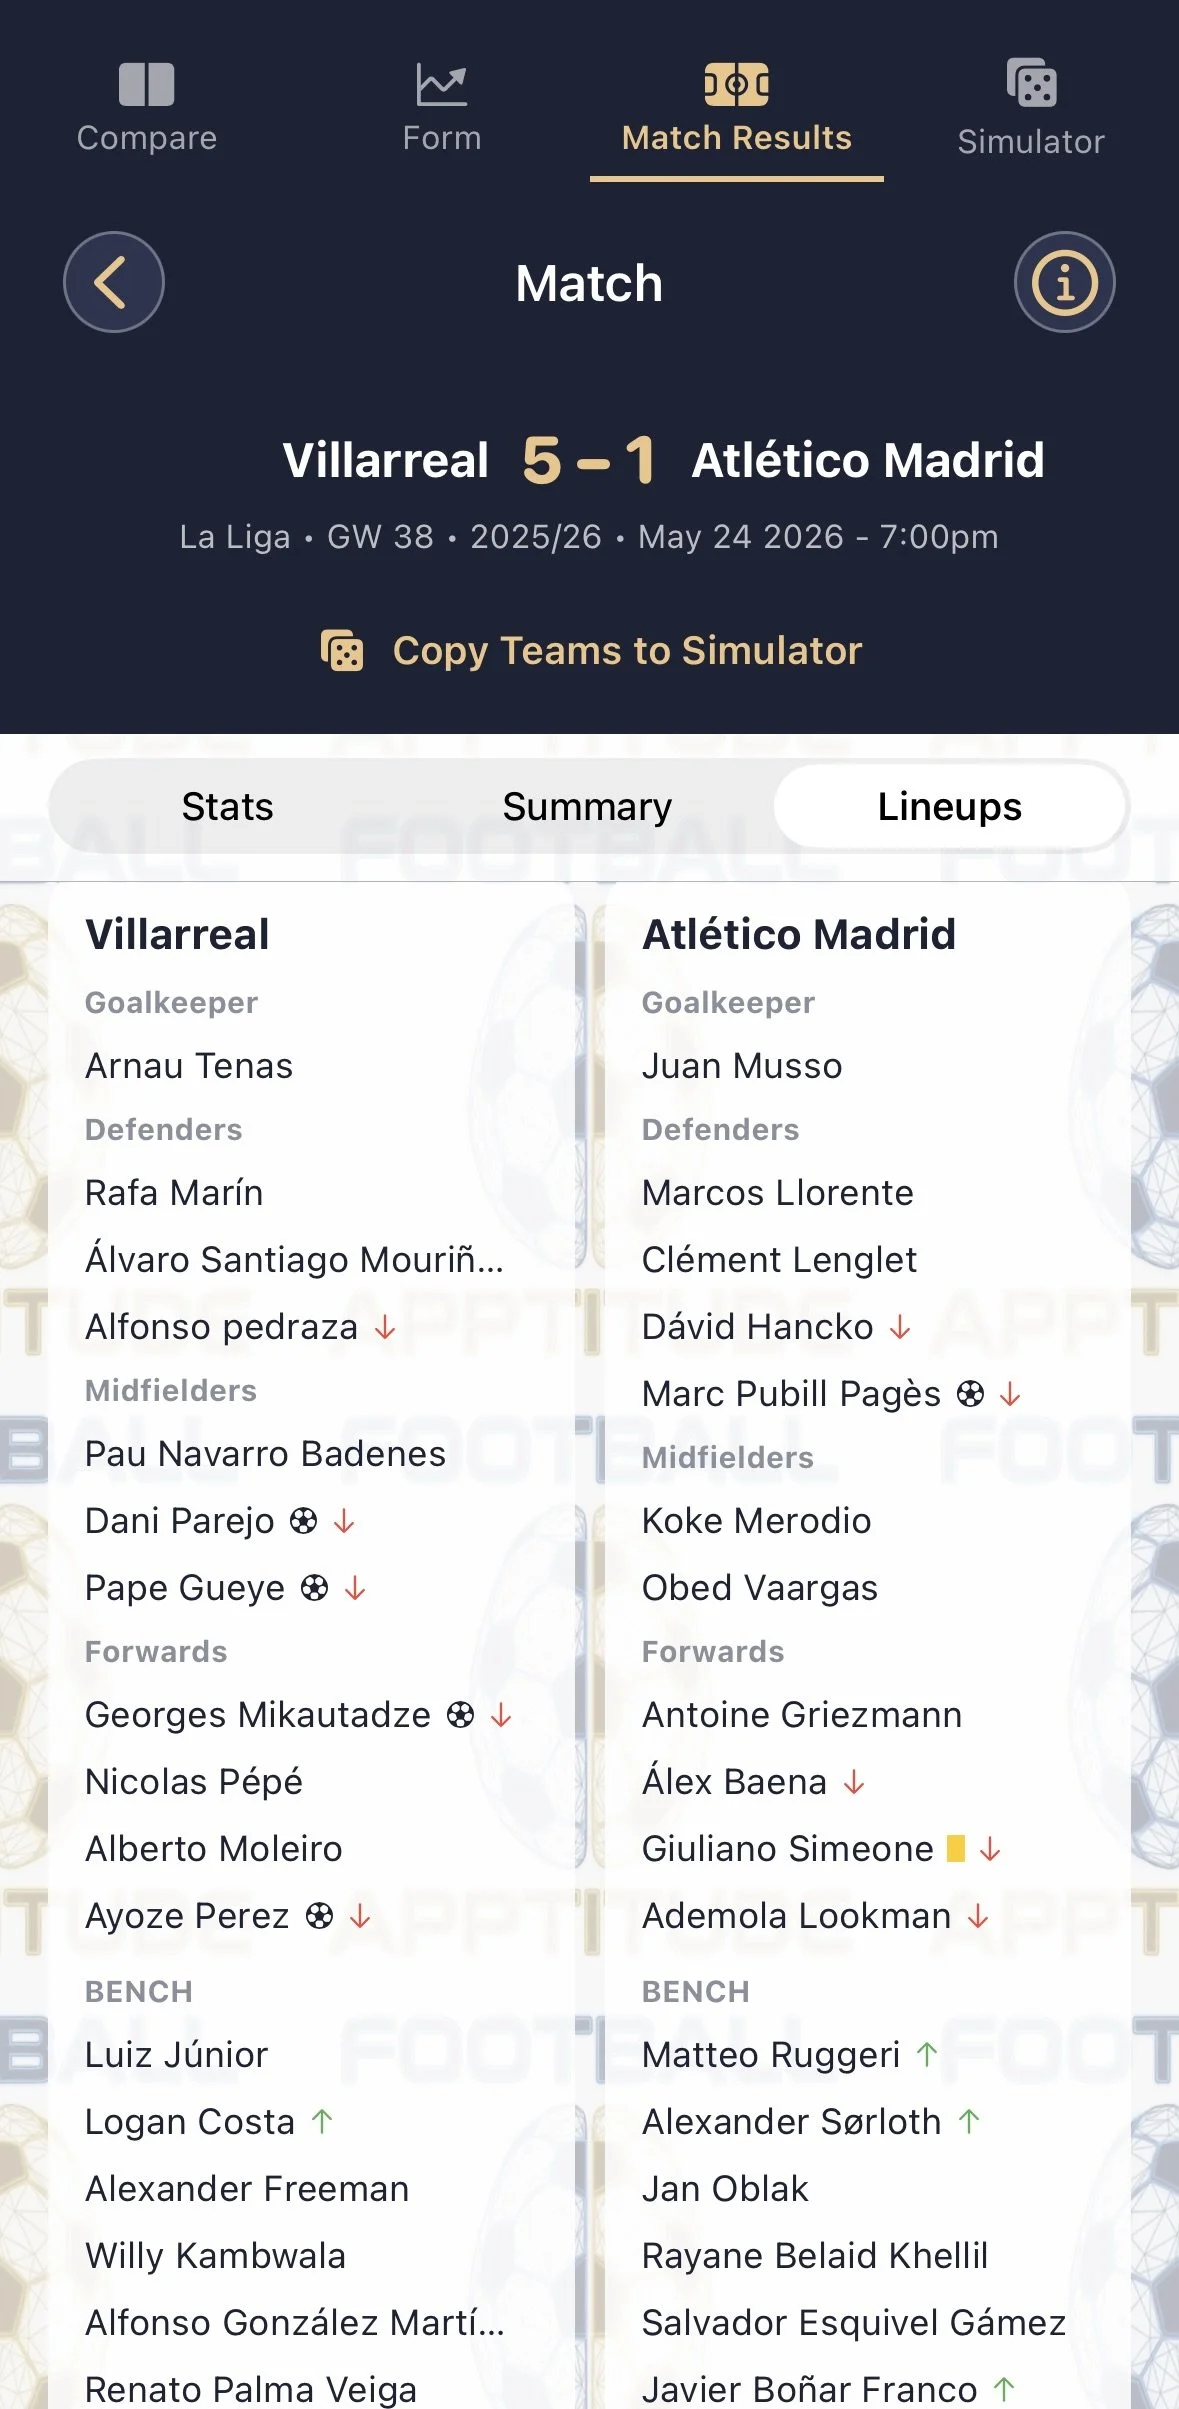
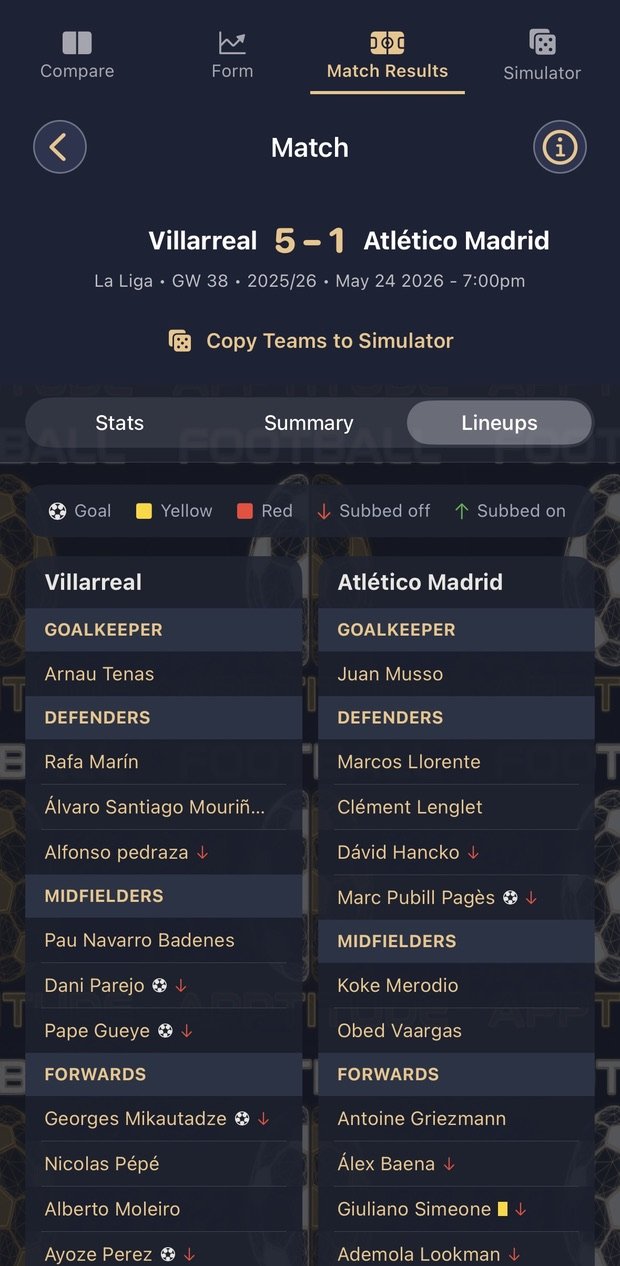
descriptive information for completed matches including stats, events and line-ups.
Completed matches can be copied over to the simulator so you can swap starting players and benches, adjust player positions and see of your changes might have impacted the result.
-
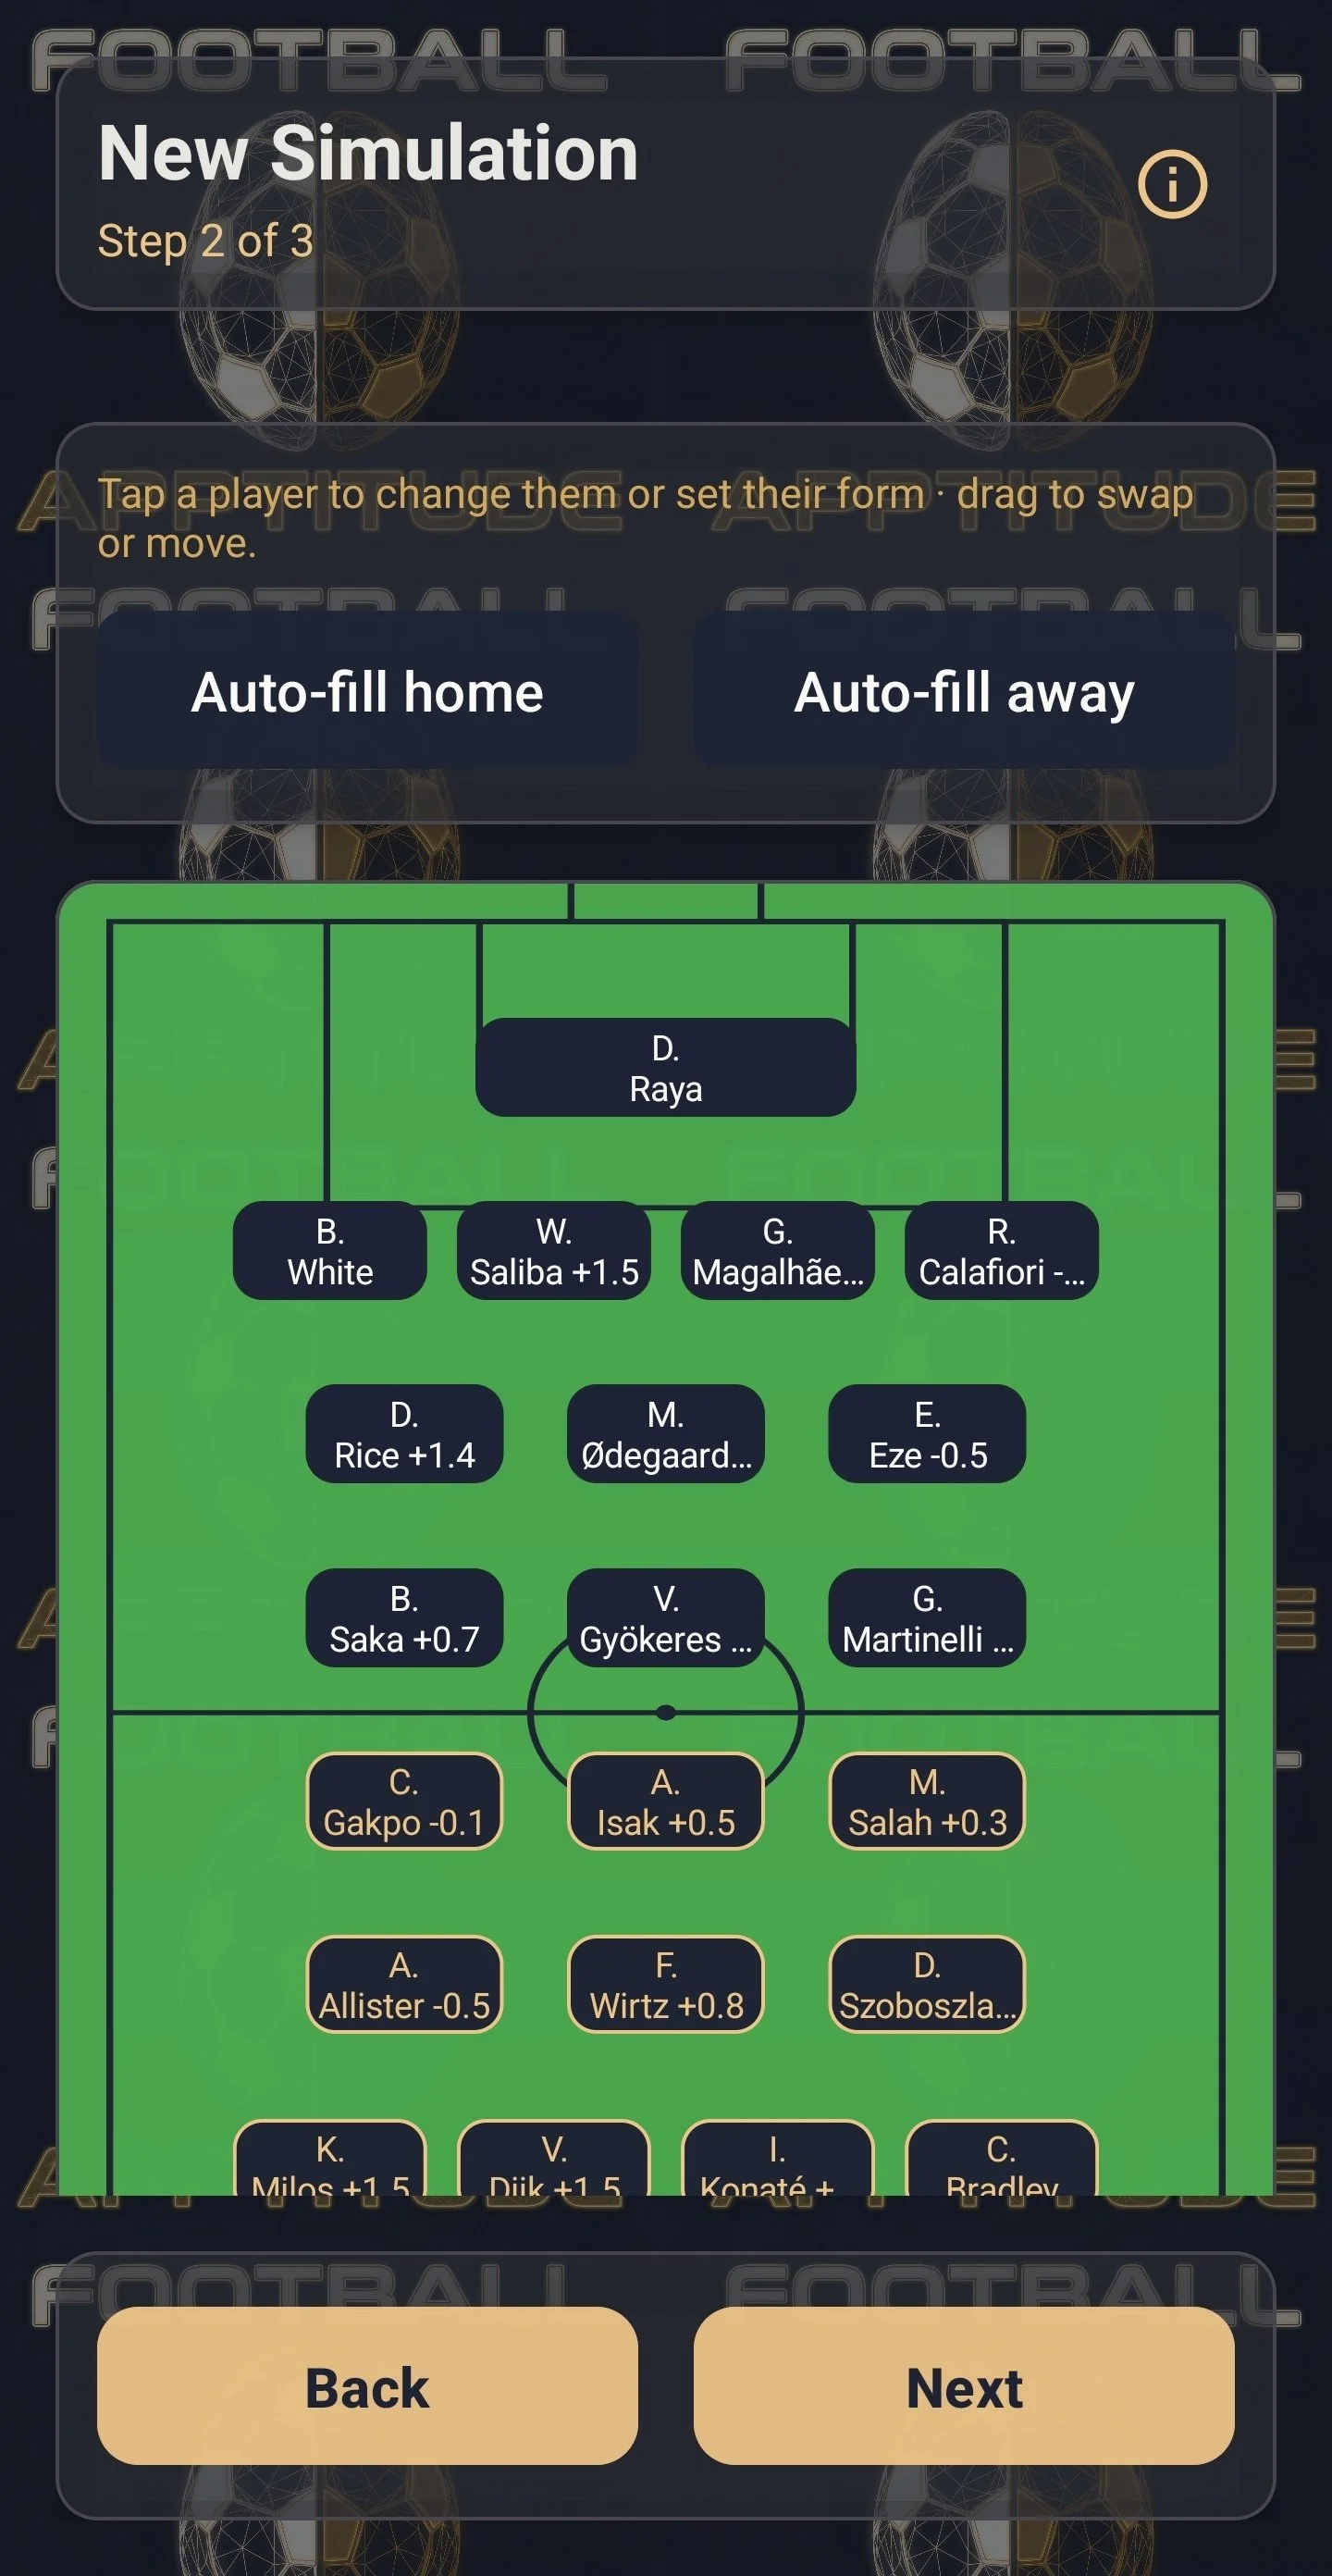
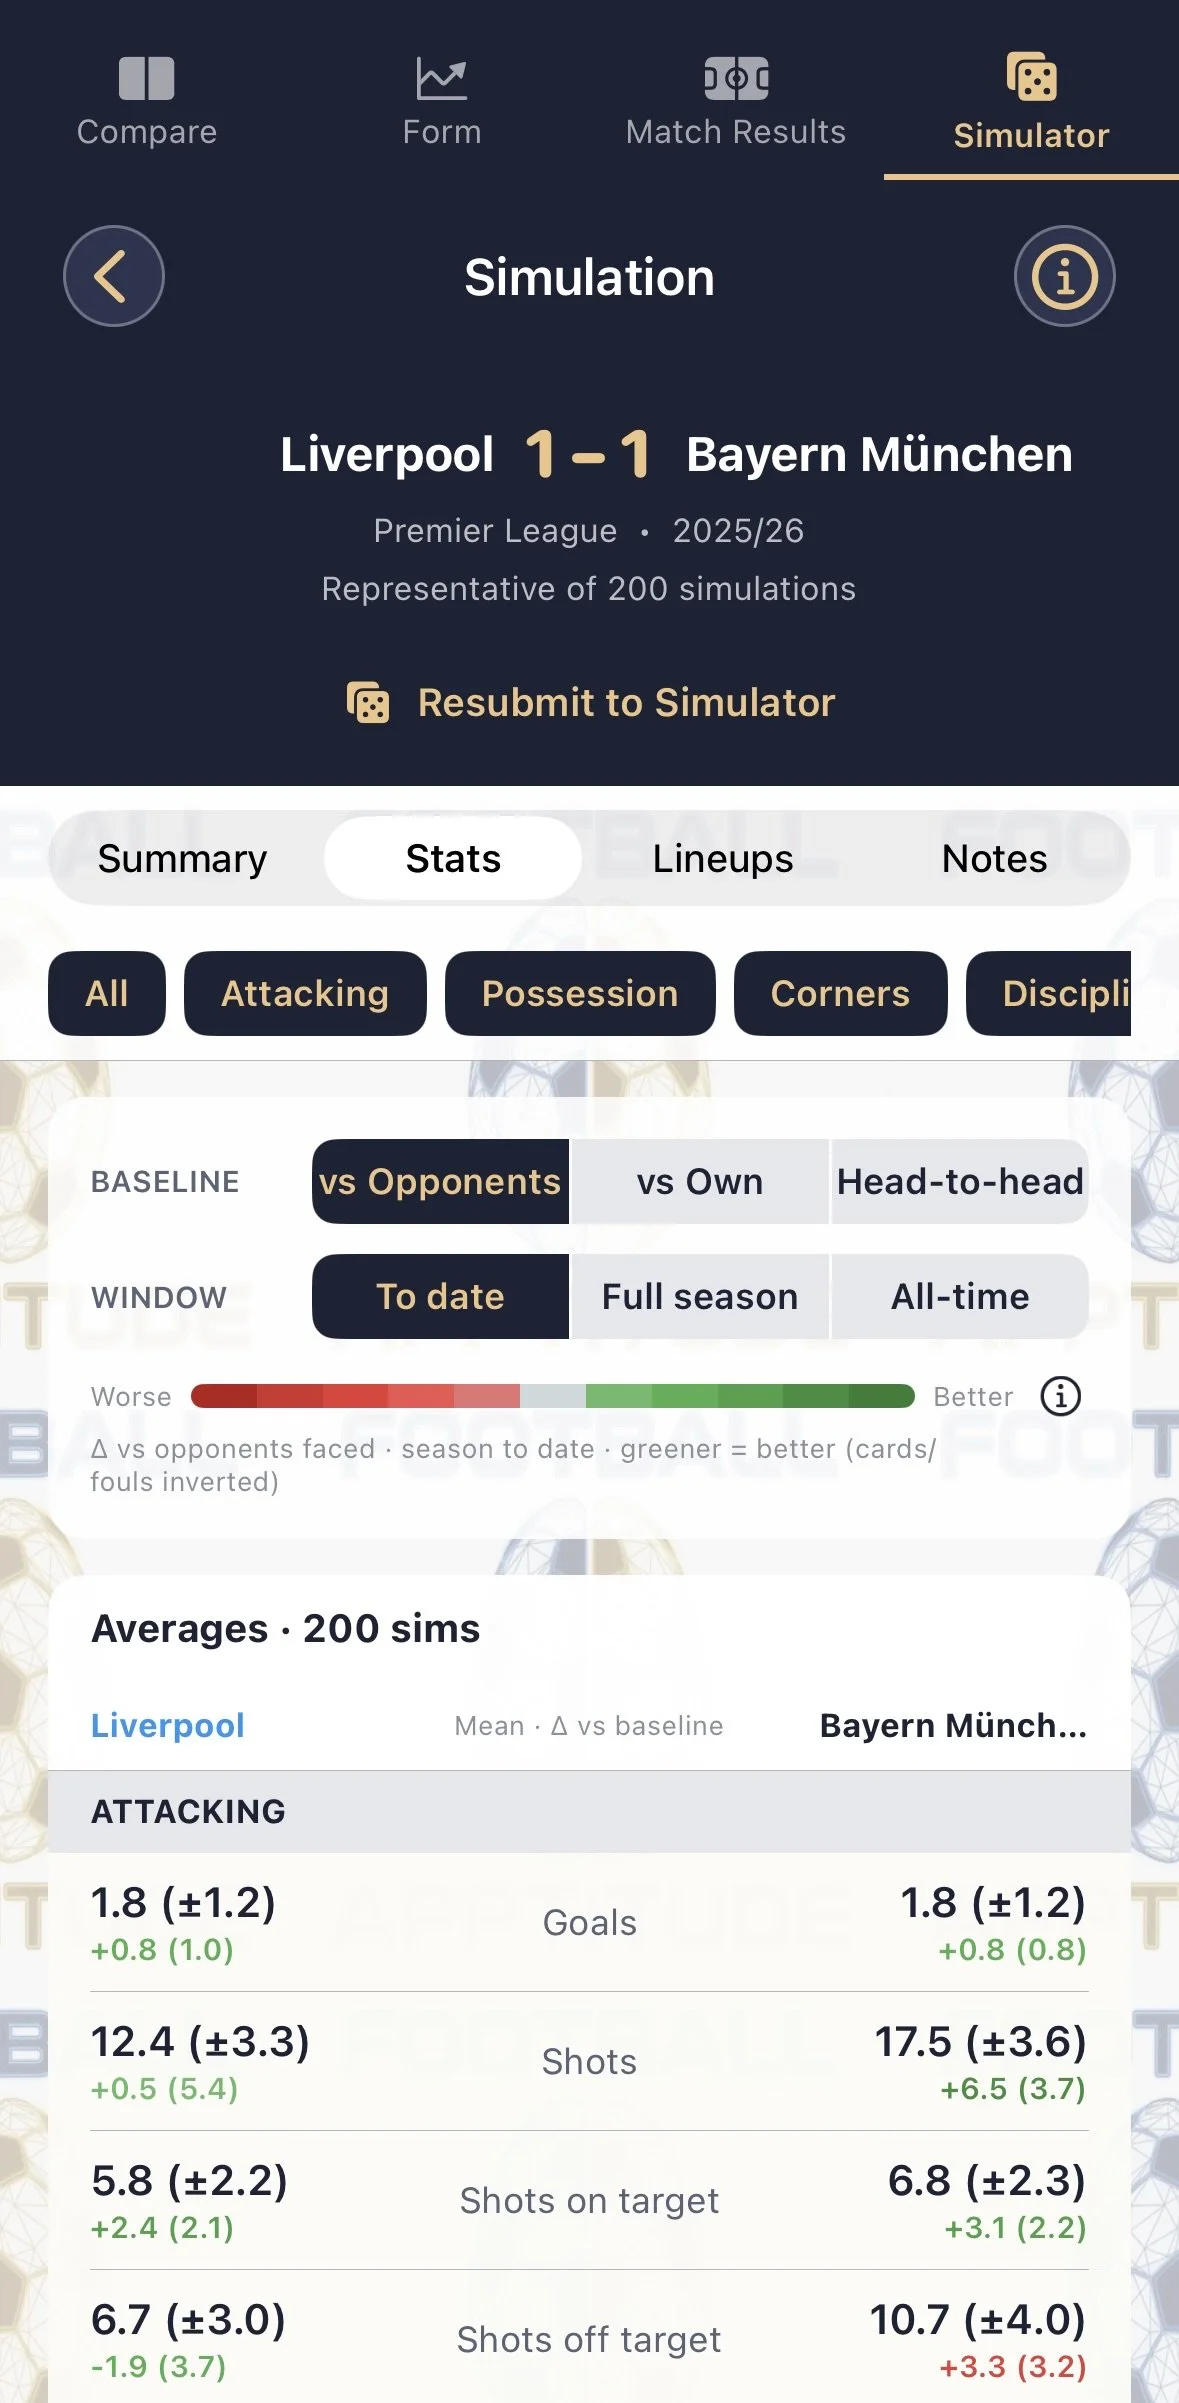
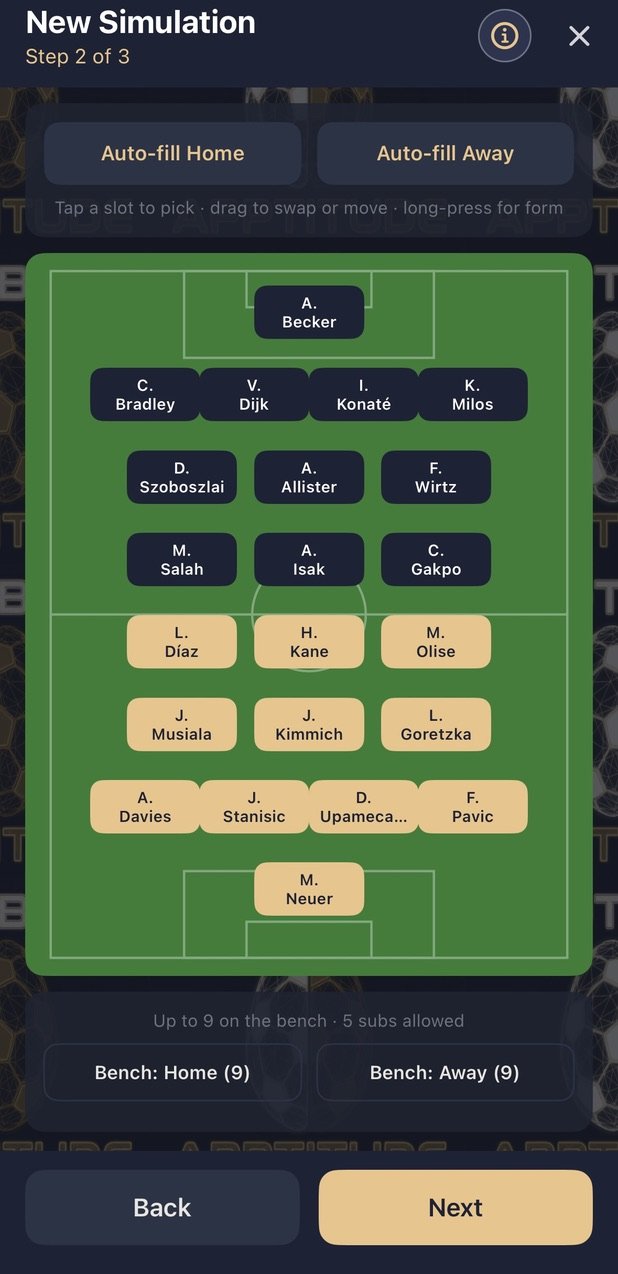
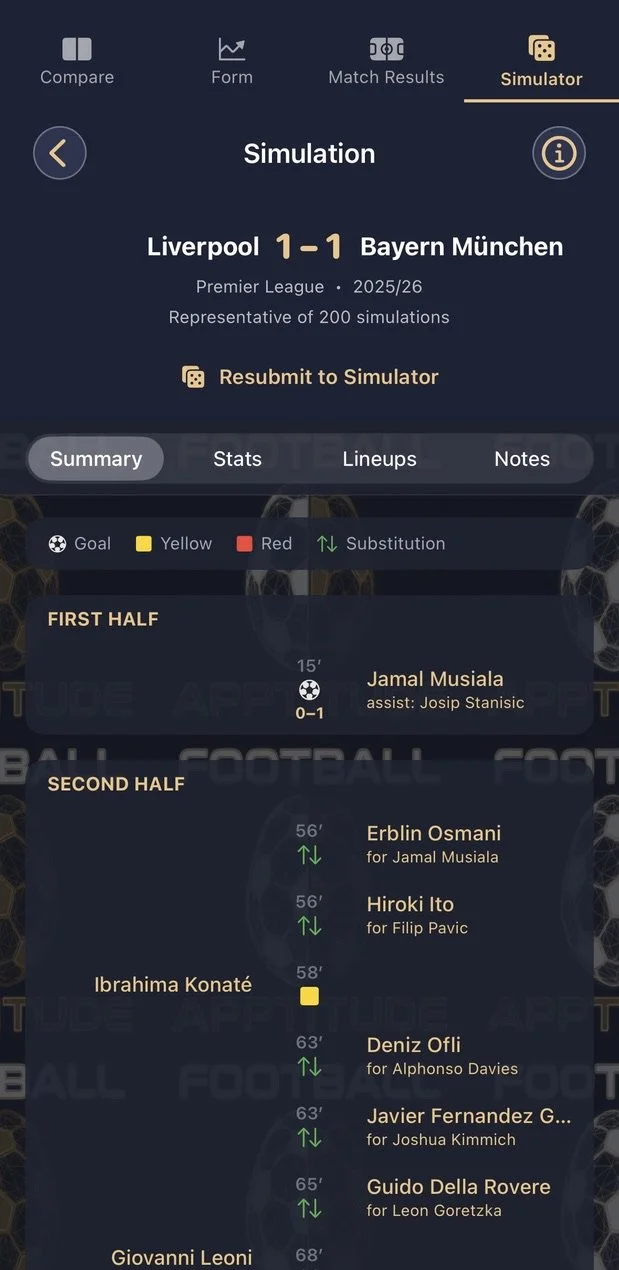
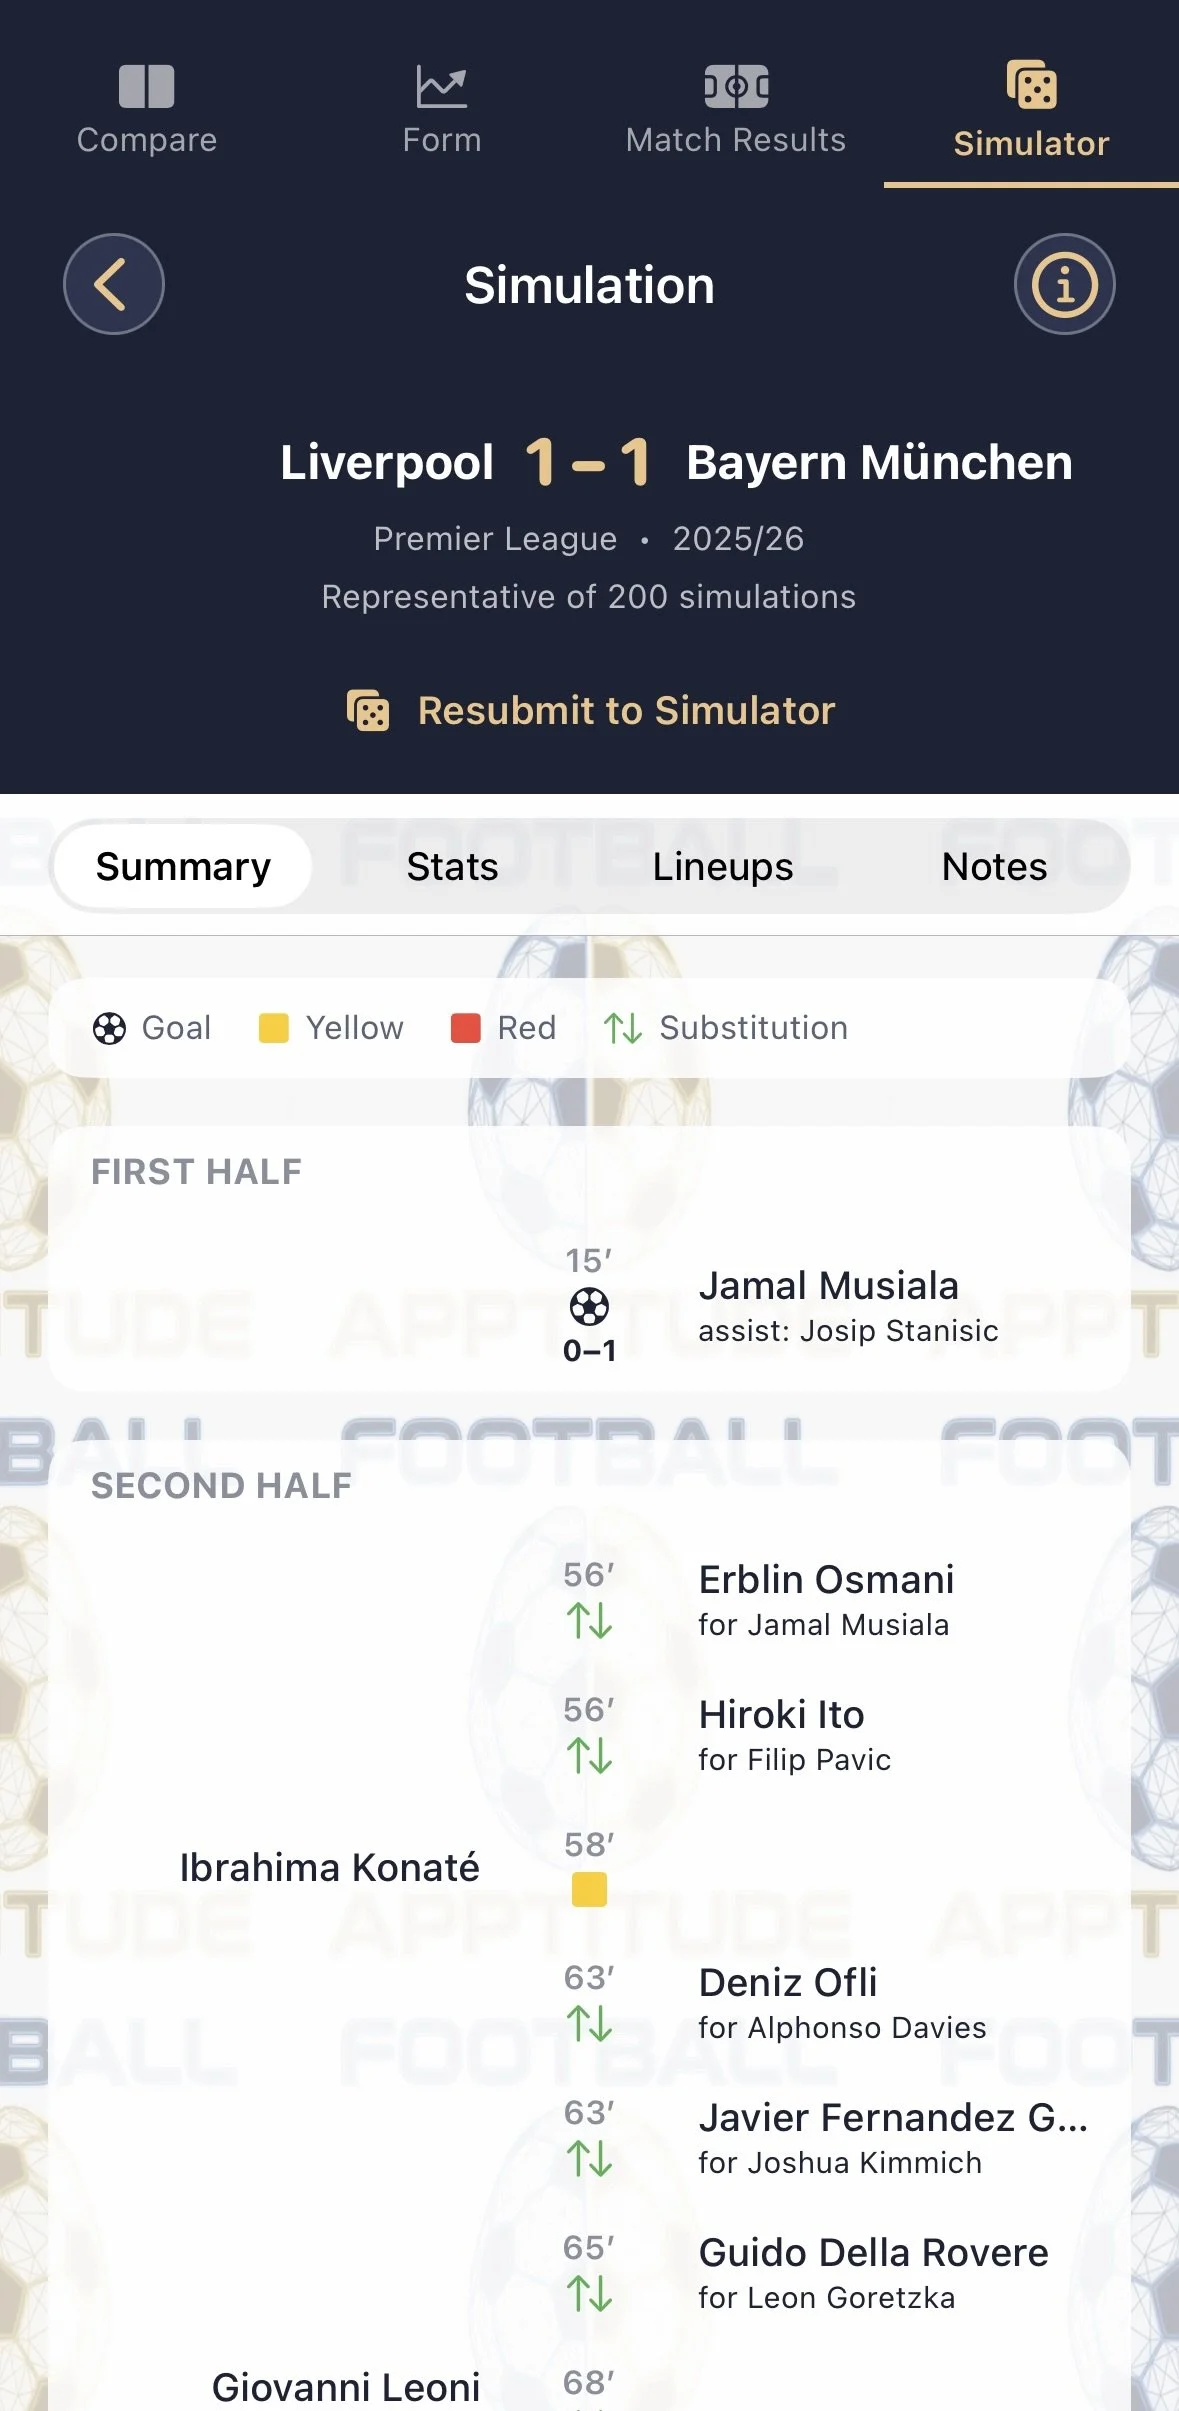
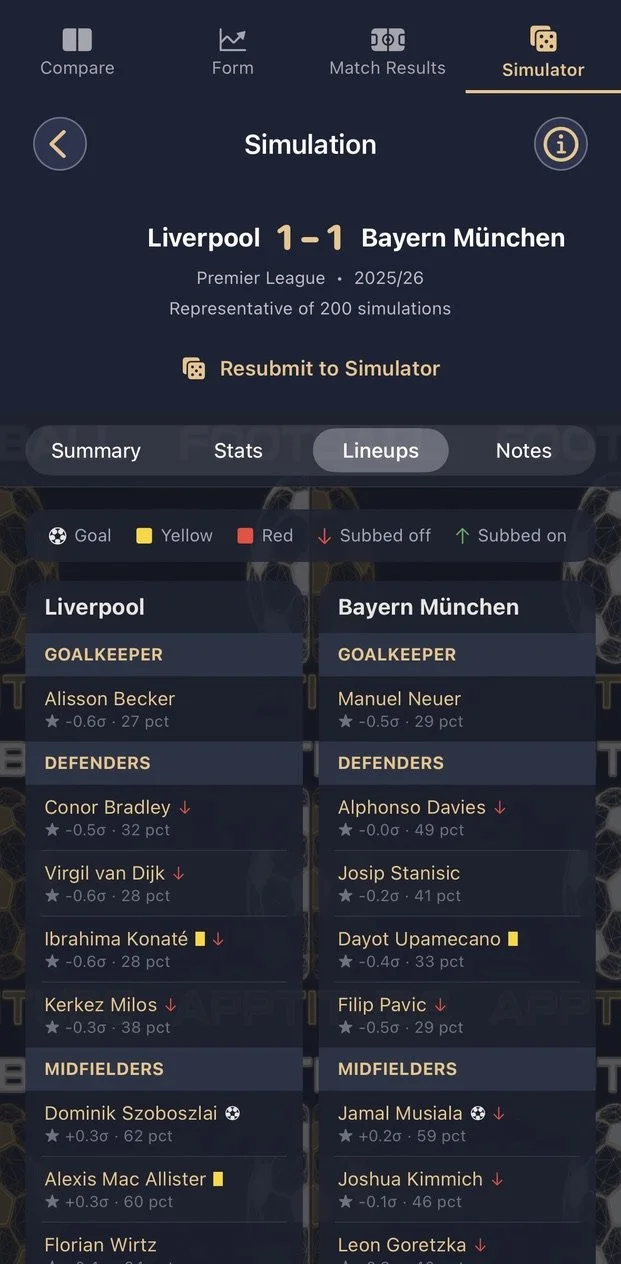
The Simulator allows you to simulate a completed or custom fixture using team and season data as a template for a fully customisable player database.
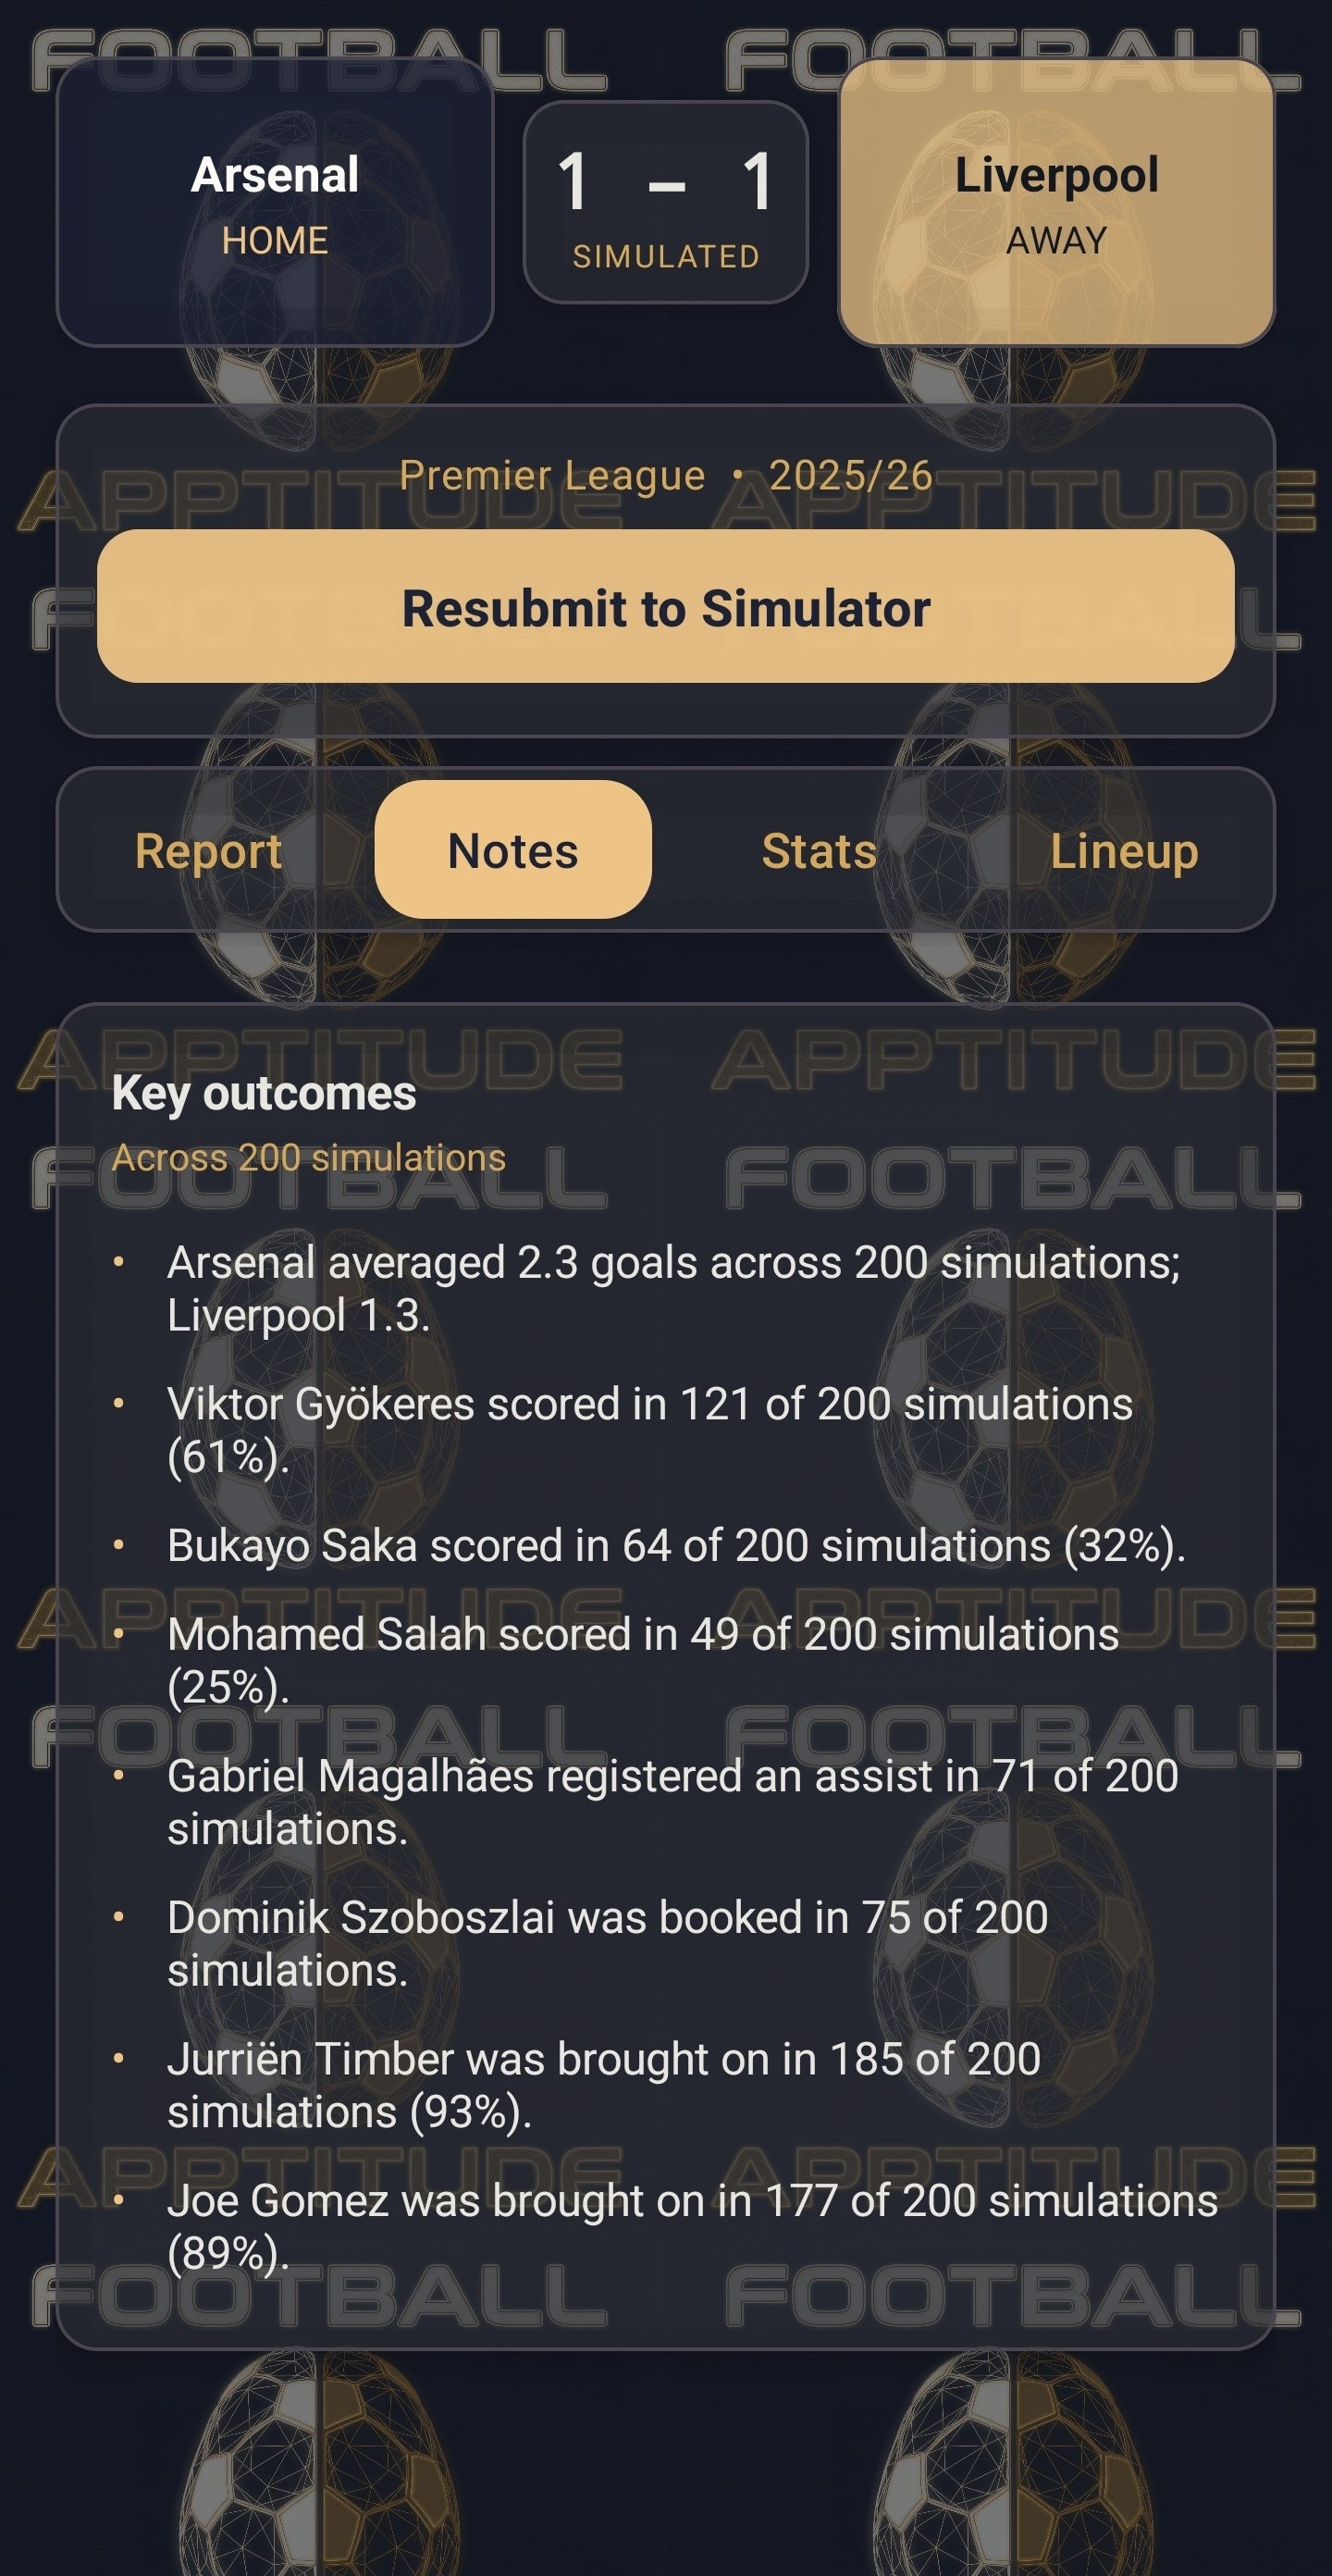
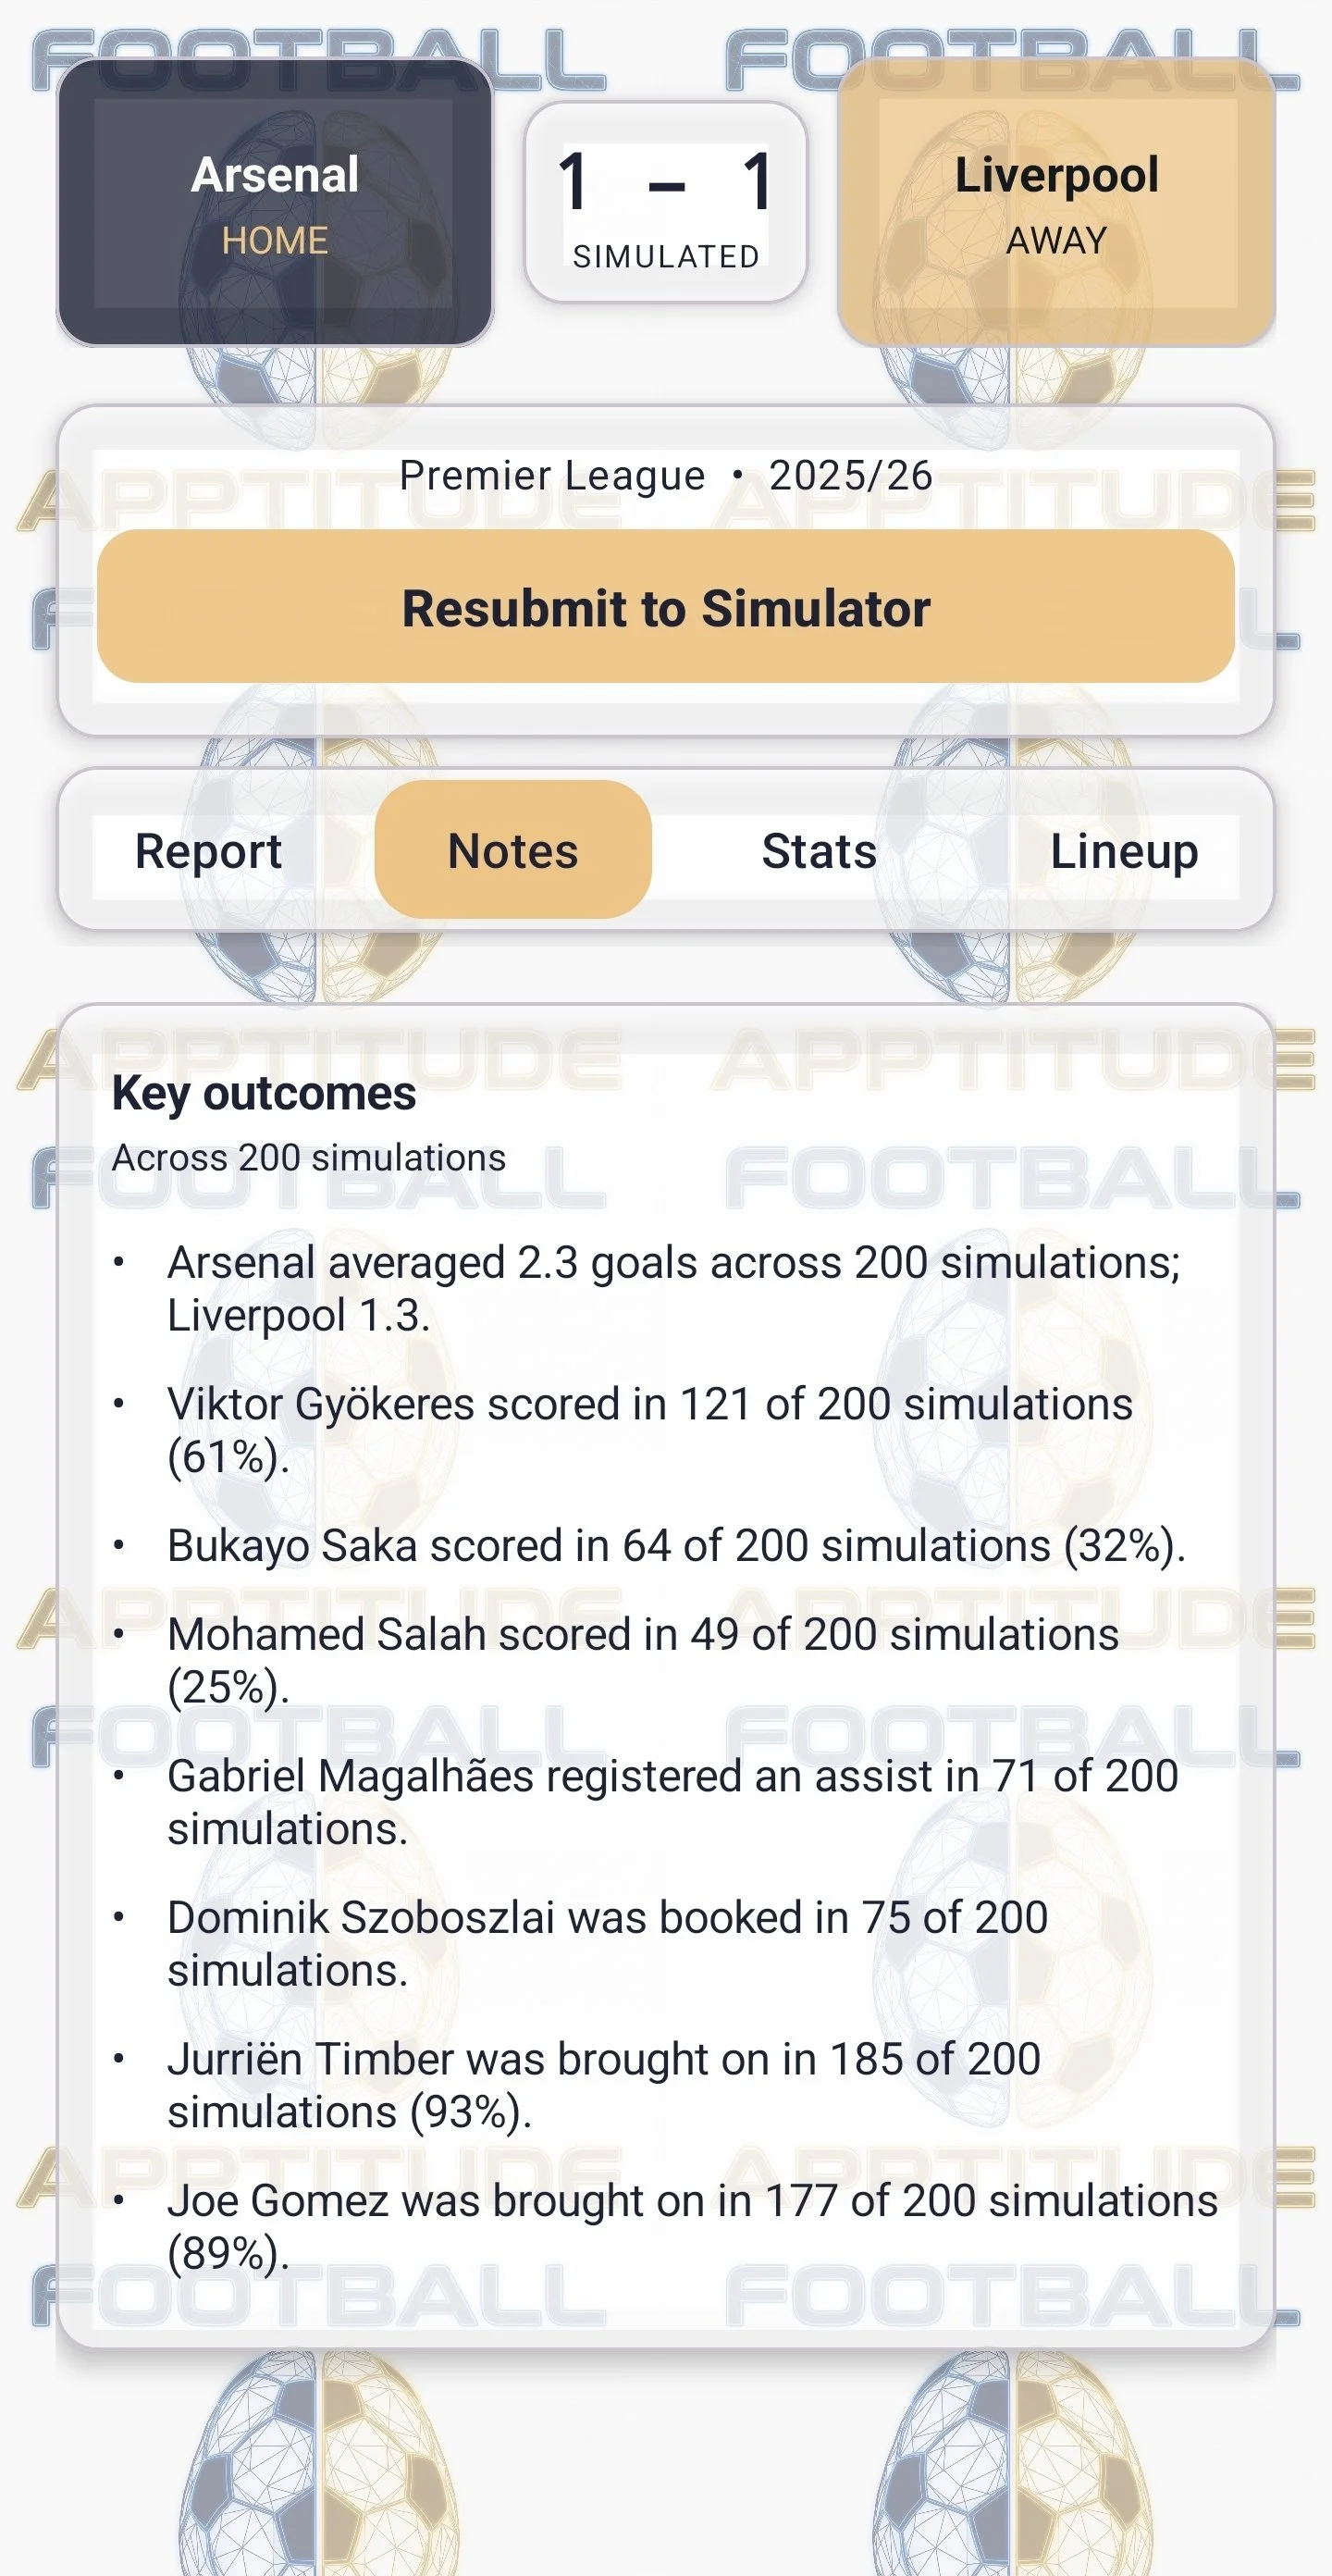
Choose the number of instances (limited to 1 at free tier), then view the simulate outcome as a result or an aggregation of instances.
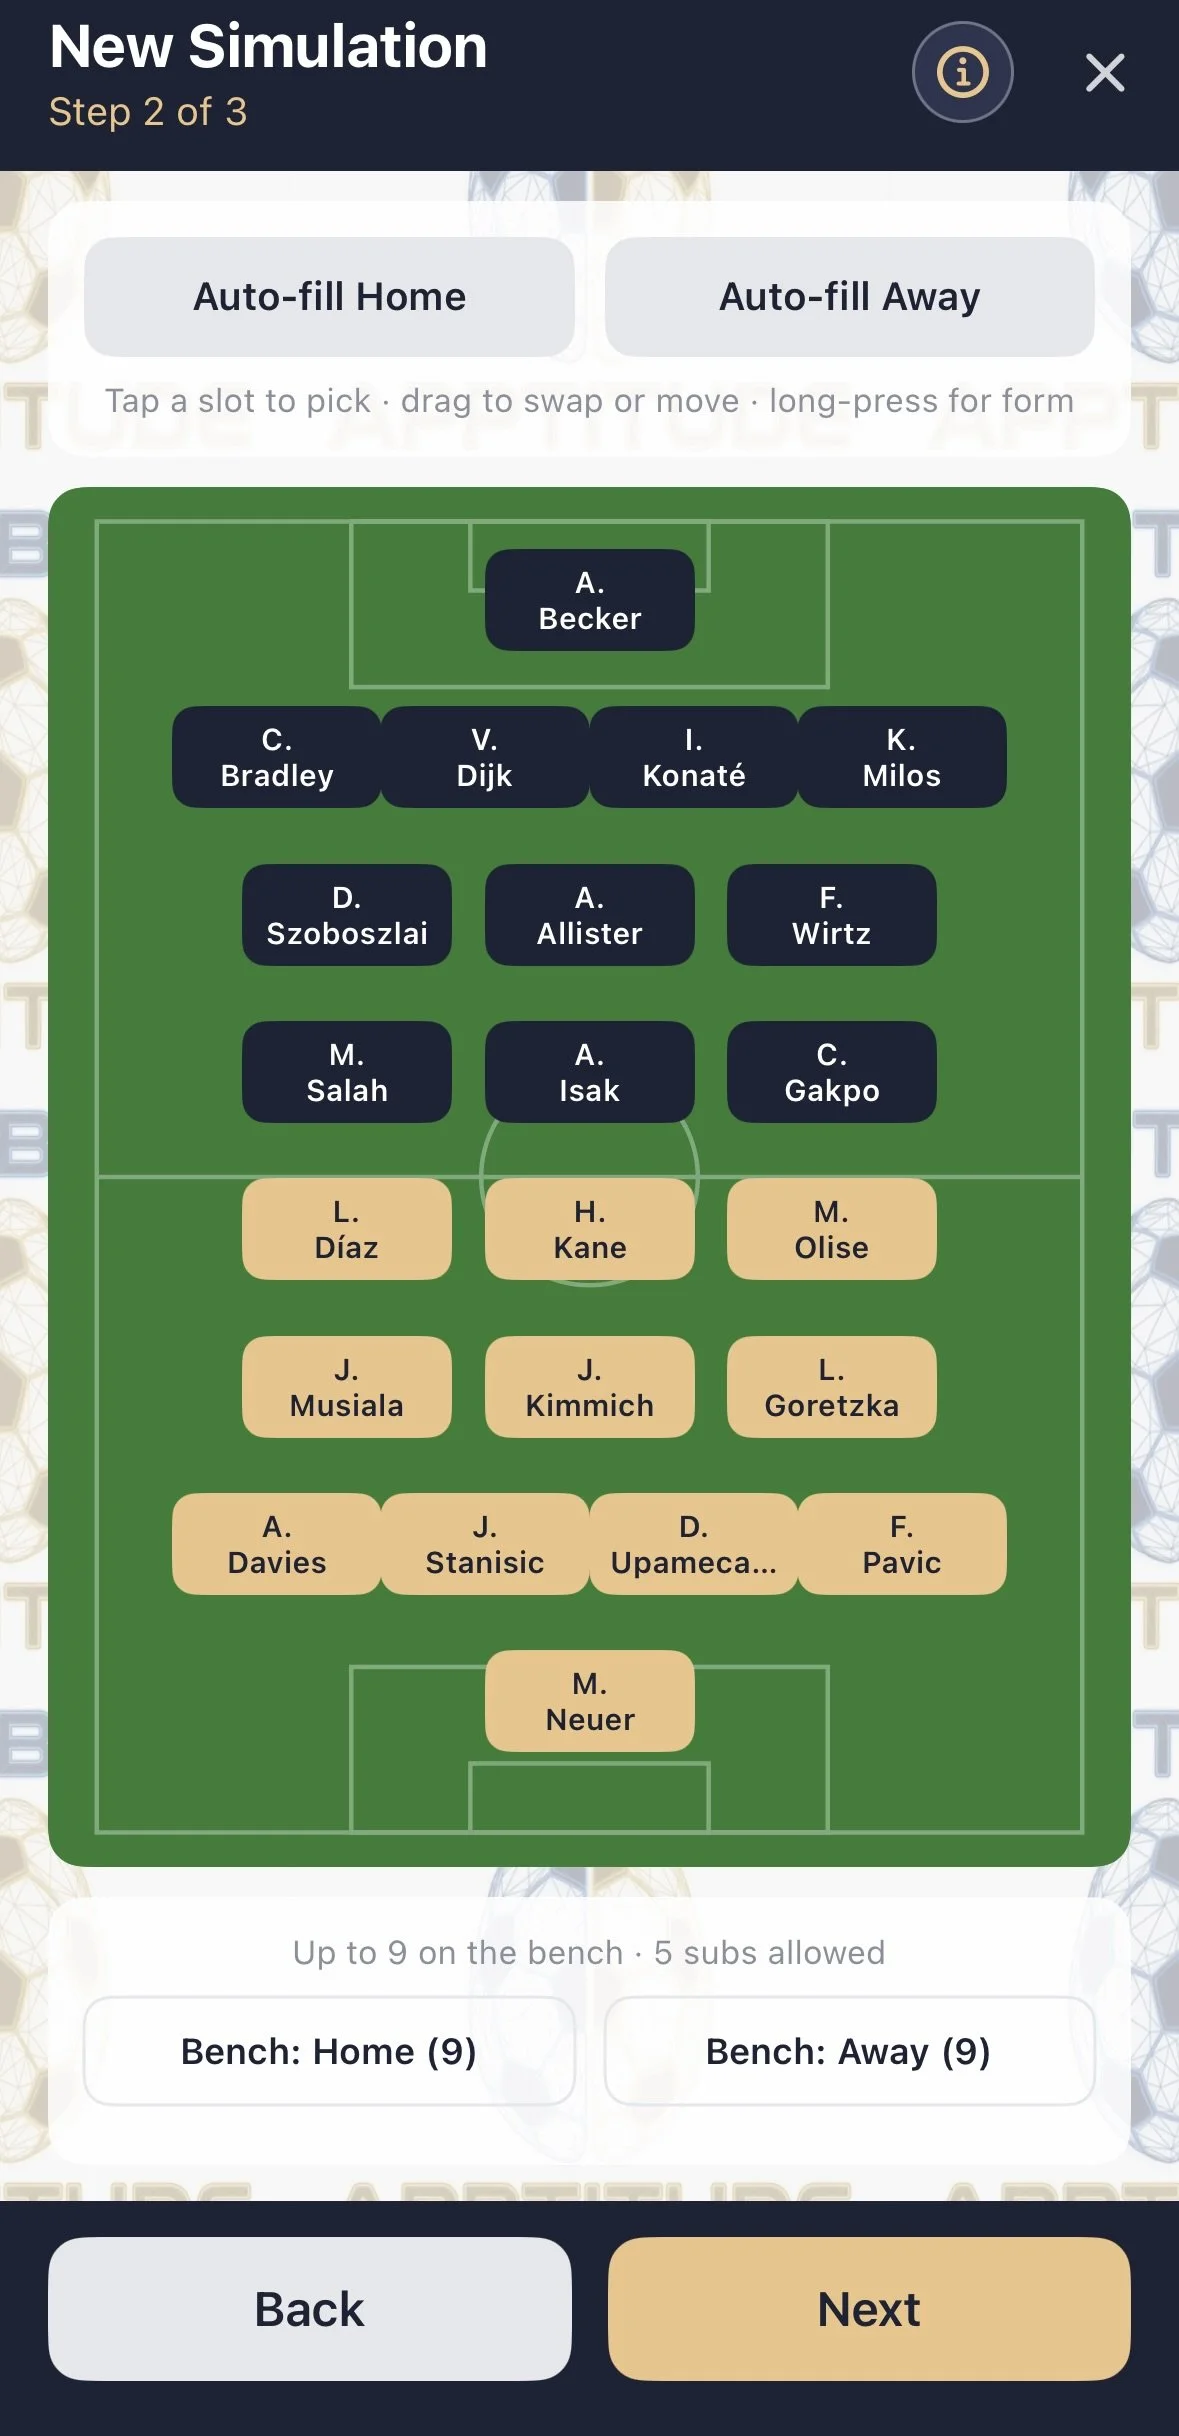
Chose from existing teams or customise your own custom 11 plus bench.
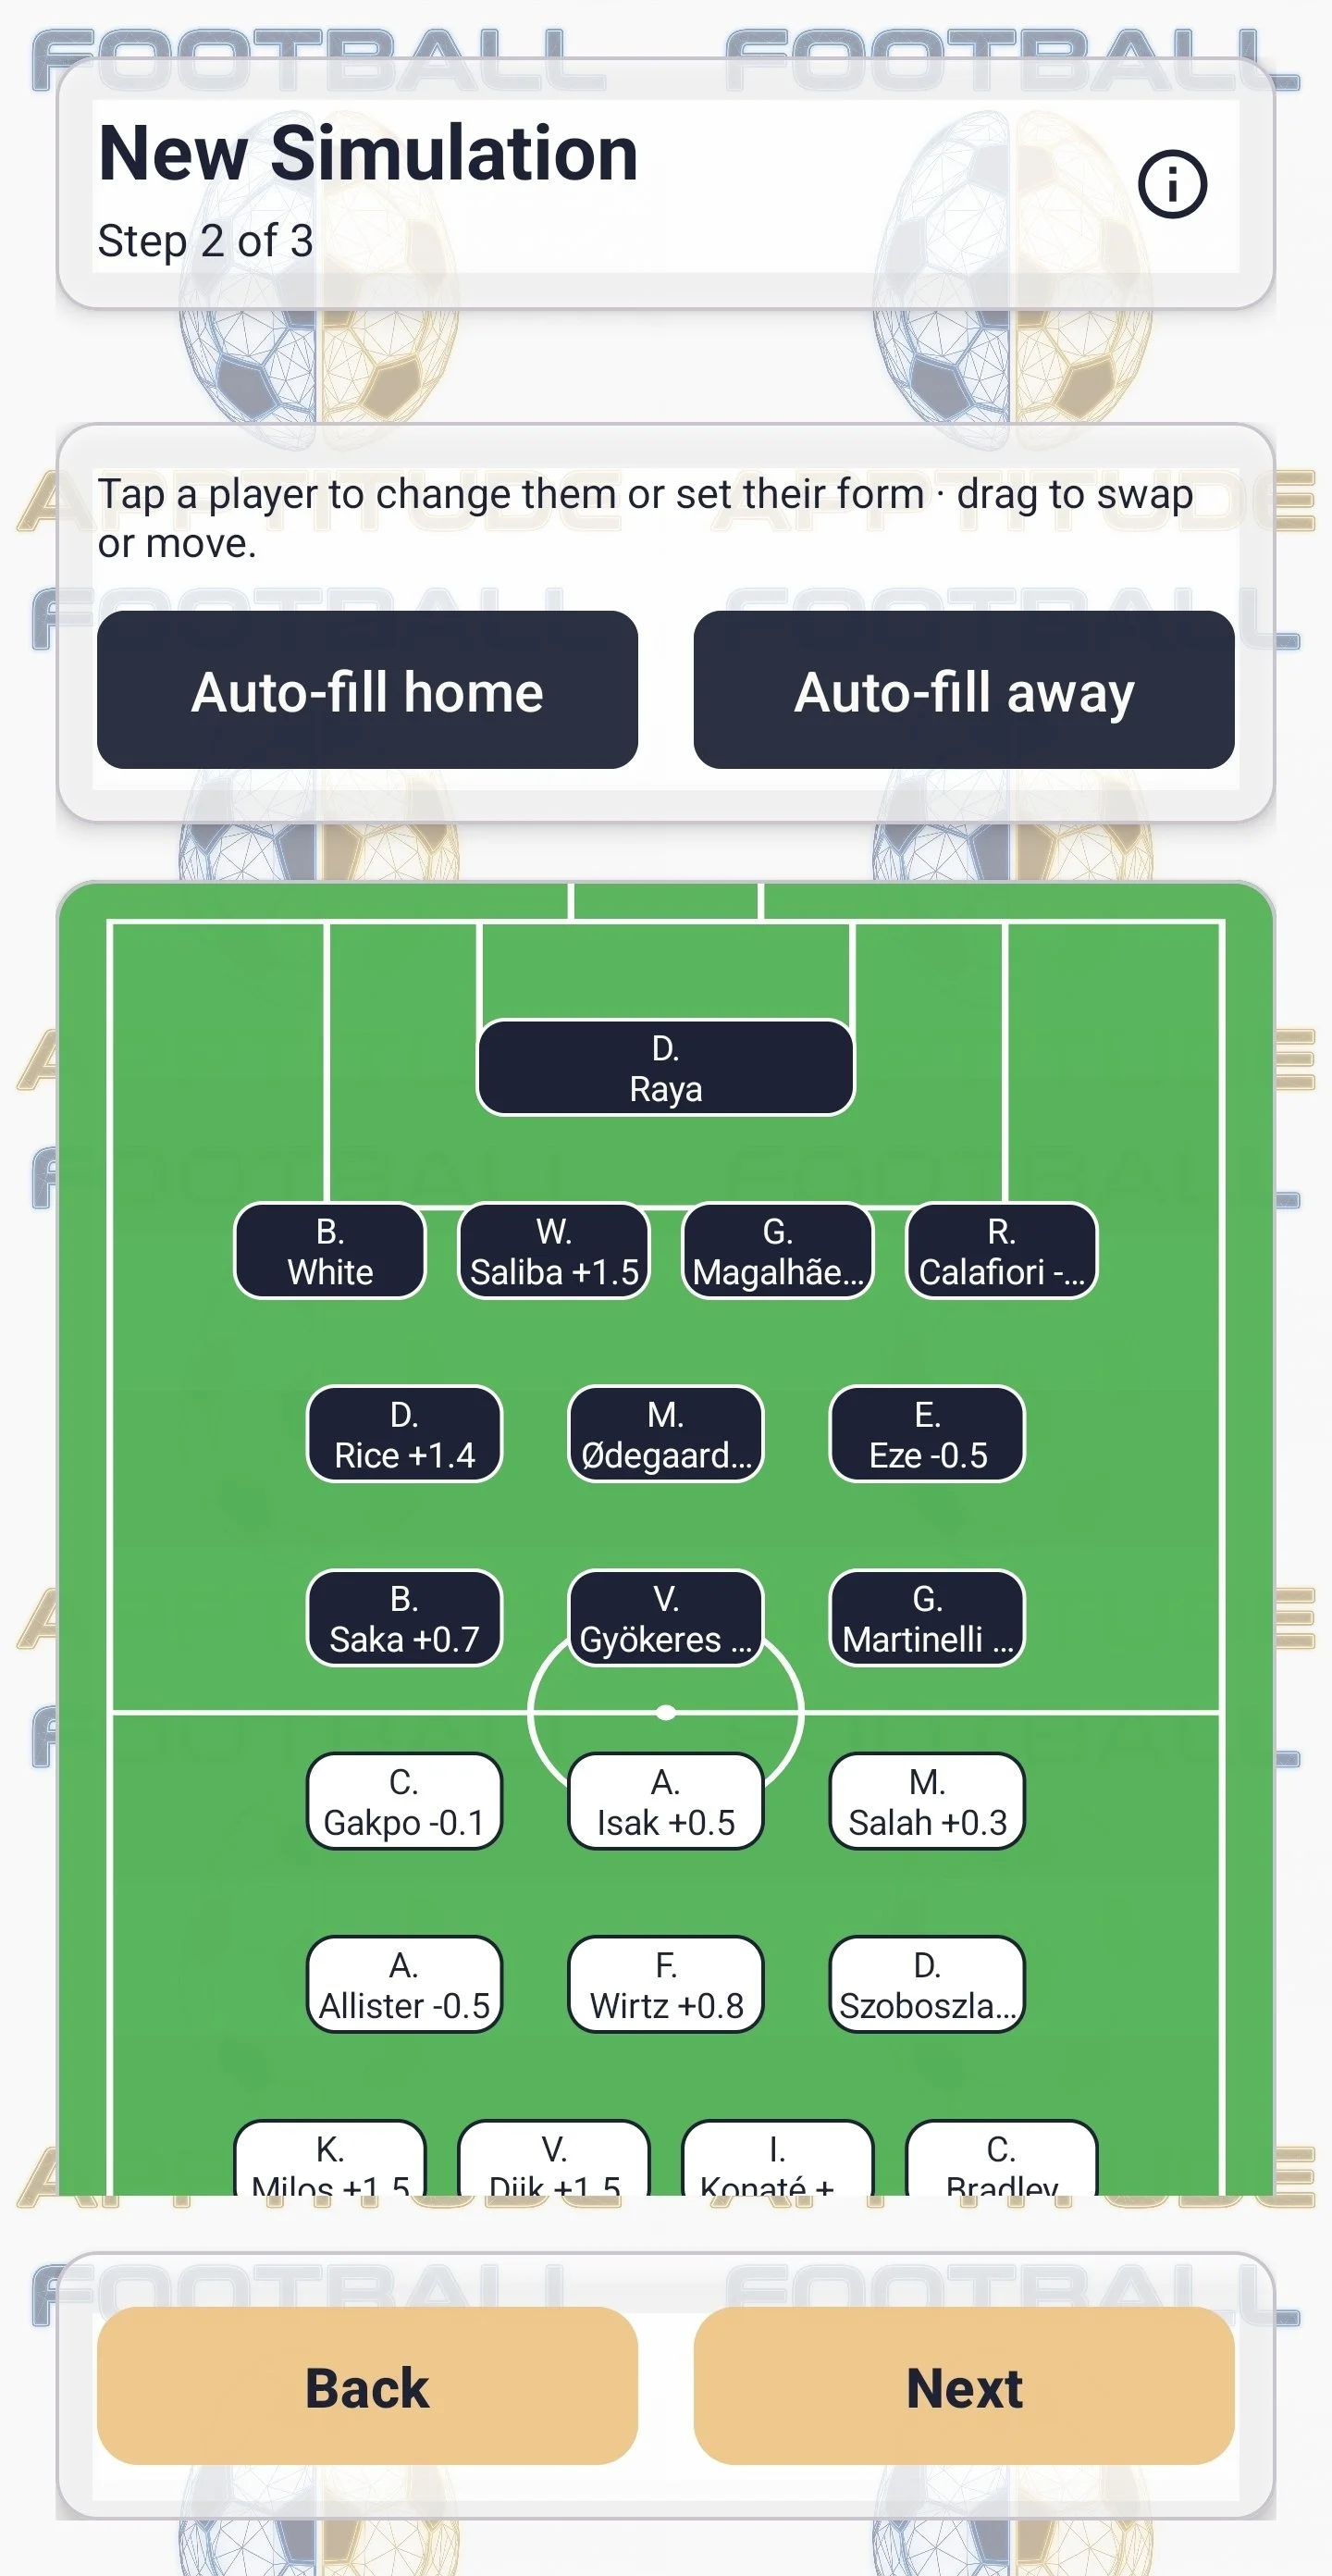
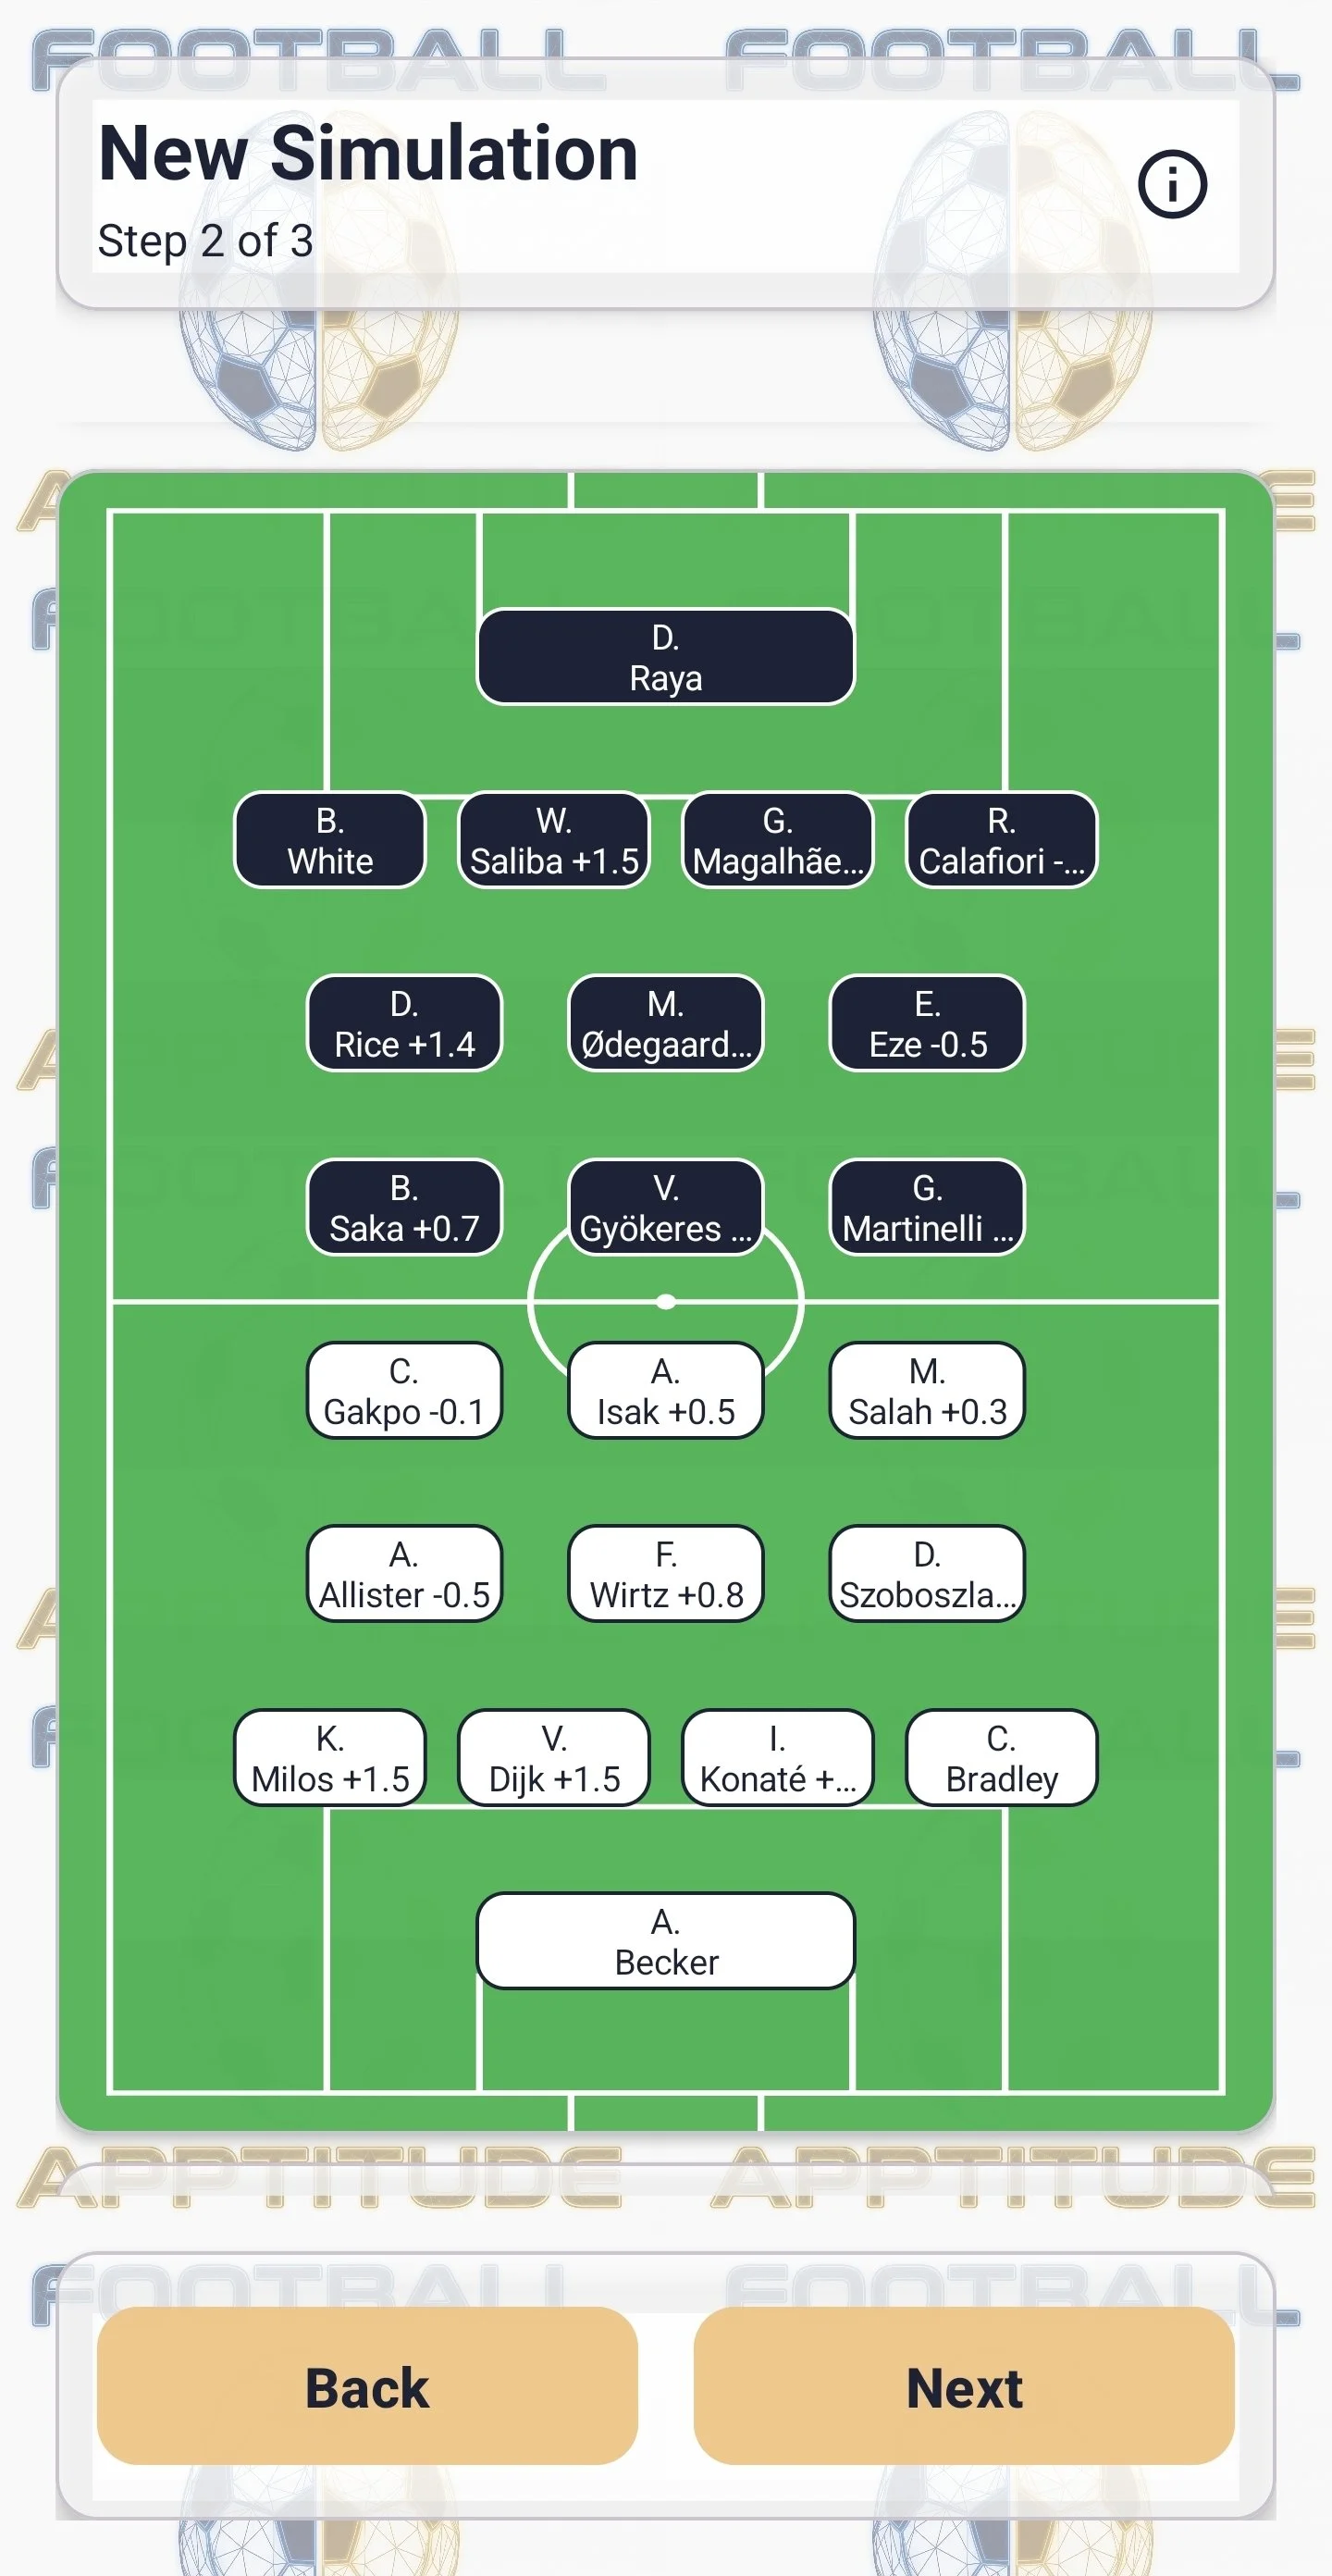
Set your line-ups from a team’s existing player, borrow players from any other team, or create a custom player.
Use the top down pitch view to set formations.
Customise the form of a player to account for eventualities such as a good player in poor form, or an average player in great form.
Simulations produce stats (with ranges if more than one instance), an event timetable , notable patters across instances (e.g.: “Salah scored in 108 of 200 instances”, “Fernandez subbed off in 62 of 150 instance”).